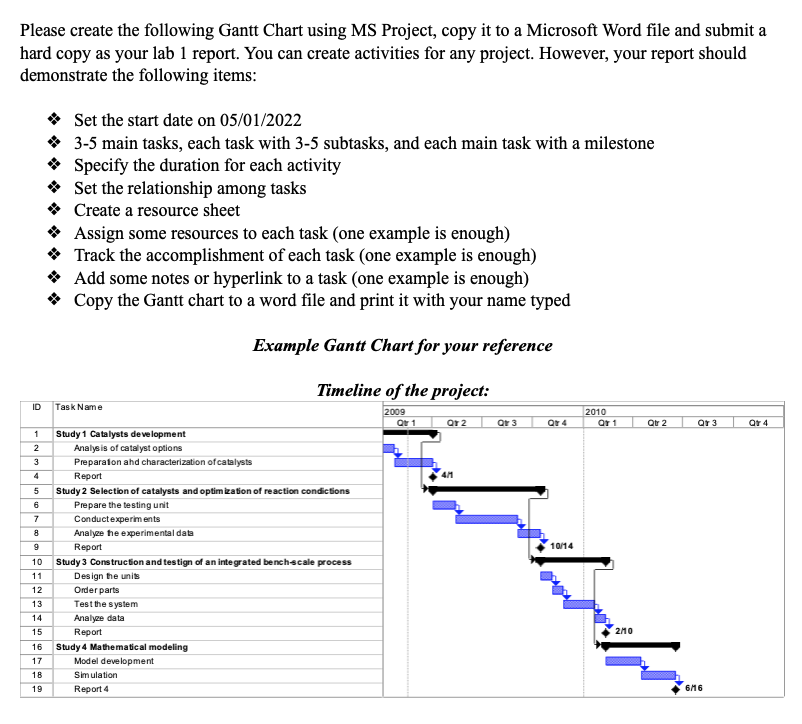
Question: Please create the following Gantt Chart using MS Project, copy it to a Microsoft Word file and submit a hard copy as your lab 1

Please create the following Gantt Chart using MS

Please create the following Gantt Chart using MS Project, copy it to a Microsoft Word file and submit a hard copy as your lab 1 report. You can create activities for any project. However, your report should demonstrate the following items: Set the start date on 05/01/2022 * 3-5 main tasks, each task with 3-5 subtasks, and each main task with a milestone * Specify the duration for each activity * Set the relationship among tasks Create a resource sheet Assign some resources to each task (one example is enough) Track the accomplishment of each task (one example is enough) Add some notes or hyperlink to a task (one example is enough) Copy the Gantt chart to a word file and print it with your name typed Example Gantt Chart for your reference ID 2010 Qr1 Otr3 Qr 4 Qtr 2 QT 3 Qr 4 1 2 3 4 5 6 7 8 Timeline of the project: Task Name 2009 Otr 1 QT2 Study 1 Catalysts development Analysis of catalyst options Preparaton and characterization of catalysts Report 411 Study 2 Selection of catalysts and optimization of reaction condictions Prepare the testing unit Conduct experiments Analyze the experimental data Report Study 3 Construction and testign of an integrated benchscale process Design the units Order parts Test the system Analyze data Report Study 4 Mathematical modeling Model development Simulation Report 4 9 10/14 10 11 12 13 14 15 2110 16 17 18 19 6/6 Please create the following Gantt Chart using MS Project, copy it to a Microsoft Word file and submit a hard copy as your lab 1 report. You can create activities for any project. However, your report should demonstrate the following items: Set the start date on 05/01/2022 * 3-5 main tasks, each task with 3-5 subtasks, and each main task with a milestone * Specify the duration for each activity * Set the relationship among tasks Create a resource sheet Assign some resources to each task (one example is enough) Track the accomplishment of each task (one example is enough) Add some notes or hyperlink to a task (one example is enough) Copy the Gantt chart to a word file and print it with your name typed Example Gantt Chart for your reference ID 2010 Qr1 Otr3 Qr 4 Qtr 2 QT 3 Qr 4 1 2 3 4 5 6 7 8 Timeline of the project: Task Name 2009 Otr 1 QT2 Study 1 Catalysts development Analysis of catalyst options Preparaton and characterization of catalysts Report 411 Study 2 Selection of catalysts and optimization of reaction condictions Prepare the testing unit Conduct experiments Analyze the experimental data Report Study 3 Construction and testign of an integrated benchscale process Design the units Order parts Test the system Analyze data Report Study 4 Mathematical modeling Model development Simulation Report 4 9 10/14 10 11 12 13 14 15 2110 16 17 18 19 6/6

Step by Step Solution

There are 3 Steps involved in it

1 Expert Approved Answer
Step: 1 Unlock blur-text-image
Question Has Been Solved by an Expert!

Get step-by-step solutions from verified subject matter experts

Step: 2 Unlock
Step: 3 Unlock

Students Have Also Explored These Related General Management Questions!