

Question: Please do it in Pyhton. No need to do the first part. Please just do the 2. Practice Data Distance Measure The data from Iris
Please do it in Pyhton. No need to do the first part. Please just do the "2. Practice Data Distance Measure"
The data from Iris data set is:
5.1,3.5,1.4,0.2,Iris-setosa 4.9,3.0,1.4,0.2,Iris-setosa 4.7,3.2,1.3,0.2,Iris-setosa 4.6,3.1,1.5,0.2,Iris-setosa 5.0,3.6,1.4,0.2,Iris-setosa 5.4,3.9,1.7,0.4,Iris-setosa 4.6,3.4,1.4,0.3,Iris-setosa 5.0,3.4,1.5,0.2,Iris-setosa 4.4,2.9,1.4,0.2,Iris-setosa 4.9,3.1,1.5,0.1,Iris-setosa 5.4,3.7,1.5,0.2,Iris-setosa 4.8,3.4,1.6,0.2,Iris-setosa 4.8,3.0,1.4,0.1,Iris-setosa 4.3,3.0,1.1,0.1,Iris-setosa 5.8,4.0,1.2,0.2,Iris-setosa 5.7,4.4,1.5,0.4,Iris-setosa 5.4,3.9,1.3,0.4,Iris-setosa 5.1,3.5,1.4,0.3,Iris-setosa 5.7,3.8,1.7,0.3,Iris-setosa 5.1,3.8,1.5,0.3,Iris-setosa 5.4,3.4,1.7,0.2,Iris-setosa 5.1,3.7,1.5,0.4,Iris-setosa 4.6,3.6,1.0,0.2,Iris-setosa 5.1,3.3,1.7,0.5,Iris-setosa 4.8,3.4,1.9,0.2,Iris-setosa 5.0,3.0,1.6,0.2,Iris-setosa 5.0,3.4,1.6,0.4,Iris-setosa 5.2,3.5,1.5,0.2,Iris-setosa 5.2,3.4,1.4,0.2,Iris-setosa 4.7,3.2,1.6,0.2,Iris-setosa 4.8,3.1,1.6,0.2,Iris-setosa 5.4,3.4,1.5,0.4,Iris-setosa 5.2,4.1,1.5,0.1,Iris-setosa 5.5,4.2,1.4,0.2,Iris-setosa 4.9,3.1,1.5,0.1,Iris-setosa 5.0,3.2,1.2,0.2,Iris-setosa 5.5,3.5,1.3,0.2,Iris-setosa 4.9,3.1,1.5,0.1,Iris-setosa 4.4,3.0,1.3,0.2,Iris-setosa 5.1,3.4,1.5,0.2,Iris-setosa 5.0,3.5,1.3,0.3,Iris-setosa 4.5,2.3,1.3,0.3,Iris-setosa 4.4,3.2,1.3,0.2,Iris-setosa 5.0,3.5,1.6,0.6,Iris-setosa 5.1,3.8,1.9,0.4,Iris-setosa 4.8,3.0,1.4,0.3,Iris-setosa 5.1,3.8,1.6,0.2,Iris-setosa 4.6,3.2,1.4,0.2,Iris-setosa 5.3,3.7,1.5,0.2,Iris-setosa 5.0,3.3,1.4,0.2,Iris-setosa 7.0,3.2,4.7,1.4,Iris-versicolor 6.4,3.2,4.5,1.5,Iris-versicolor 6.9,3.1,4.9,1.5,Iris-versicolor 5.5,2.3,4.0,1.3,Iris-versicolor 6.5,2.8,4.6,1.5,Iris-versicolor 5.7,2.8,4.5,1.3,Iris-versicolor 6.3,3.3,4.7,1.6,Iris-versicolor 4.9,2.4,3.3,1.0,Iris-versicolor 6.6,2.9,4.6,1.3,Iris-versicolor 5.2,2.7,3.9,1.4,Iris-versicolor 5.0,2.0,3.5,1.0,Iris-versicolor 5.9,3.0,4.2,1.5,Iris-versicolor 6.0,2.2,4.0,1.0,Iris-versicolor 6.1,2.9,4.7,1.4,Iris-versicolor 5.6,2.9,3.6,1.3,Iris-versicolor 6.7,3.1,4.4,1.4,Iris-versicolor 5.6,3.0,4.5,1.5,Iris-versicolor 5.8,2.7,4.1,1.0,Iris-versicolor 6.2,2.2,4.5,1.5,Iris-versicolor 5.6,2.5,3.9,1.1,Iris-versicolor 5.9,3.2,4.8,1.8,Iris-versicolor 6.1,2.8,4.0,1.3,Iris-versicolor 6.3,2.5,4.9,1.5,Iris-versicolor 6.1,2.8,4.7,1.2,Iris-versicolor 6.4,2.9,4.3,1.3,Iris-versicolor 6.6,3.0,4.4,1.4,Iris-versicolor 6.8,2.8,4.8,1.4,Iris-versicolor 6.7,3.0,5.0,1.7,Iris-versicolor 6.0,2.9,4.5,1.5,Iris-versicolor 5.7,2.6,3.5,1.0,Iris-versicolor 5.5,2.4,3.8,1.1,Iris-versicolor 5.5,2.4,3.7,1.0,Iris-versicolor 5.8,2.7,3.9,1.2,Iris-versicolor 6.0,2.7,5.1,1.6,Iris-versicolor 5.4,3.0,4.5,1.5,Iris-versicolor 6.0,3.4,4.5,1.6,Iris-versicolor 6.7,3.1,4.7,1.5,Iris-versicolor 6.3,2.3,4.4,1.3,Iris-versicolor 5.6,3.0,4.1,1.3,Iris-versicolor 5.5,2.5,4.0,1.3,Iris-versicolor 5.5,2.6,4.4,1.2,Iris-versicolor 6.1,3.0,4.6,1.4,Iris-versicolor 5.8,2.6,4.0,1.2,Iris-versicolor 5.0,2.3,3.3,1.0,Iris-versicolor 5.6,2.7,4.2,1.3,Iris-versicolor 5.7,3.0,4.2,1.2,Iris-versicolor 5.7,2.9,4.2,1.3,Iris-versicolor 6.2,2.9,4.3,1.3,Iris-versicolor 5.1,2.5,3.0,1.1,Iris-versicolor 5.7,2.8,4.1,1.3,Iris-versicolor 6.3,3.3,6.0,2.5,Iris-virginica 5.8,2.7,5.1,1.9,Iris-virginica 7.1,3.0,5.9,2.1,Iris-virginica 6.3,2.9,5.6,1.8,Iris-virginica 6.5,3.0,5.8,2.2,Iris-virginica 7.6,3.0,6.6,2.1,Iris-virginica 4.9,2.5,4.5,1.7,Iris-virginica 7.3,2.9,6.3,1.8,Iris-virginica 6.7,2.5,5.8,1.8,Iris-virginica 7.2,3.6,6.1,2.5,Iris-virginica 6.5,3.2,5.1,2.0,Iris-virginica 6.4,2.7,5.3,1.9,Iris-virginica 6.8,3.0,5.5,2.1,Iris-virginica 5.7,2.5,5.0,2.0,Iris-virginica 5.8,2.8,5.1,2.4,Iris-virginica 6.4,3.2,5.3,2.3,Iris-virginica 6.5,3.0,5.5,1.8,Iris-virginica 7.7,3.8,6.7,2.2,Iris-virginica 7.7,2.6,6.9,2.3,Iris-virginica 6.0,2.2,5.0,1.5,Iris-virginica 6.9,3.2,5.7,2.3,Iris-virginica 5.6,2.8,4.9,2.0,Iris-virginica 7.7,2.8,6.7,2.0,Iris-virginica 6.3,2.7,4.9,1.8,Iris-virginica 6.7,3.3,5.7,2.1,Iris-virginica 7.2,3.2,6.0,1.8,Iris-virginica 6.2,2.8,4.8,1.8,Iris-virginica 6.1,3.0,4.9,1.8,Iris-virginica 6.4,2.8,5.6,2.1,Iris-virginica 7.2,3.0,5.8,1.6,Iris-virginica 7.4,2.8,6.1,1.9,Iris-virginica 7.9,3.8,6.4,2.0,Iris-virginica 6.4,2.8,5.6,2.2,Iris-virginica 6.3,2.8,5.1,1.5,Iris-virginica 6.1,2.6,5.6,1.4,Iris-virginica 7.7,3.0,6.1,2.3,Iris-virginica 6.3,3.4,5.6,2.4,Iris-virginica 6.4,3.1,5.5,1.8,Iris-virginica 6.0,3.0,4.8,1.8,Iris-virginica 6.9,3.1,5.4,2.1,Iris-virginica 6.7,3.1,5.6,2.4,Iris-virginica 6.9,3.1,5.1,2.3,Iris-virginica 5.8,2.7,5.1,1.9,Iris-virginica 6.8,3.2,5.9,2.3,Iris-virginica 6.7,3.3,5.7,2.5,Iris-virginica 6.7,3.0,5.2,2.3,Iris-virginica 6.3,2.5,5.0,1.9,Iris-virginica 6.5,3.0,5.2,2.0,Iris-virginica 6.2,3.4,5.4,2.3,Iris-virginica 5.9,3.0,5.1,1.8,Iris-virginica
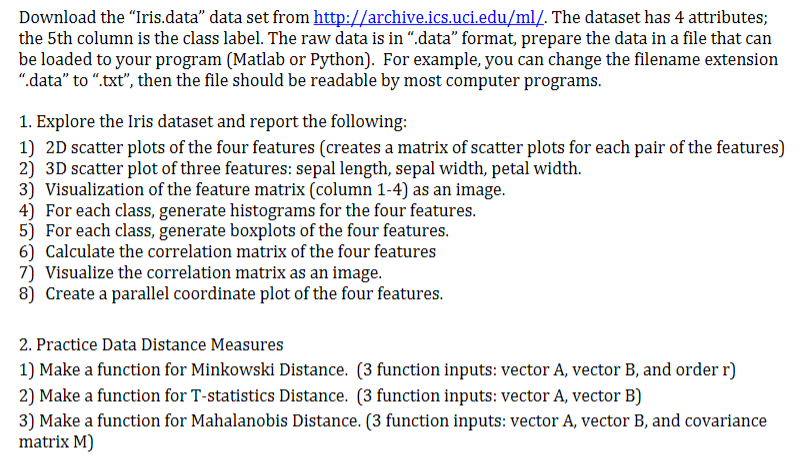
Download the Iris.data data set from http://archive.ics.uci.edu/ml/. The dataset has 4 attributes; the 5th column is the class label. The raw data is in ".data" format, prepare the data in a file that can be loaded to your program (Matlab or Python). For example, you can change the filename extension ".data" to ".txt", then the file should be readable by most computer programs. 1. Explore the Iris dataset and report the following: 1) 2D scatter plots of the four features (creates a matrix of scatter plots for each pair of the features) 2) 3D scatter plot of three features: sepal length, sepal width, petal width. 3) Visualization of the feature matrix (column 1-4) as an image. 4) For each class, generate histograms for the four features. 5) For each class, generate boxplots of the four features. 6) Calculate the correlation matrix of the four features 7) Visualize the correlation matrix as an image. 8) Create a parallel coordinate plot of the four features. 2. Practice Data Distance Measures 1) Make a function for Minkowski Distance. (3 function inputs: vector A, vector B, and order r) 2) Make a function for T-statistics Distance. (3 function inputs: vector A, vector B) 3) Make a function for Mahalanobis Distance. (3 function inputs: vector A, vector B, and covariance matrix M) Download the Iris.data data set from http://archive.ics.uci.edu/ml/. The dataset has 4 attributes; the 5th column is the class label. The raw data is in ".data" format, prepare the data in a file that can be loaded to your program (Matlab or Python). For example, you can change the filename extension ".data" to ".txt", then the file should be readable by most computer programs. 1. Explore the Iris dataset and report the following: 1) 2D scatter plots of the four features (creates a matrix of scatter plots for each pair of the features) 2) 3D scatter plot of three features: sepal length, sepal width, petal width. 3) Visualization of the feature matrix (column 1-4) as an image. 4) For each class, generate histograms for the four features. 5) For each class, generate boxplots of the four features. 6) Calculate the correlation matrix of the four features 7) Visualize the correlation matrix as an image. 8) Create a parallel coordinate plot of the four features. 2. Practice Data Distance Measures 1) Make a function for Minkowski Distance. (3 function inputs: vector A, vector B, and order r) 2) Make a function for T-statistics Distance. (3 function inputs: vector A, vector B) 3) Make a function for Mahalanobis Distance. (3 function inputs: vector A, vector B, and covariance matrix M)
Step by Step Solution
There are 3 Steps involved in it

Get step-by-step solutions from verified subject matter experts