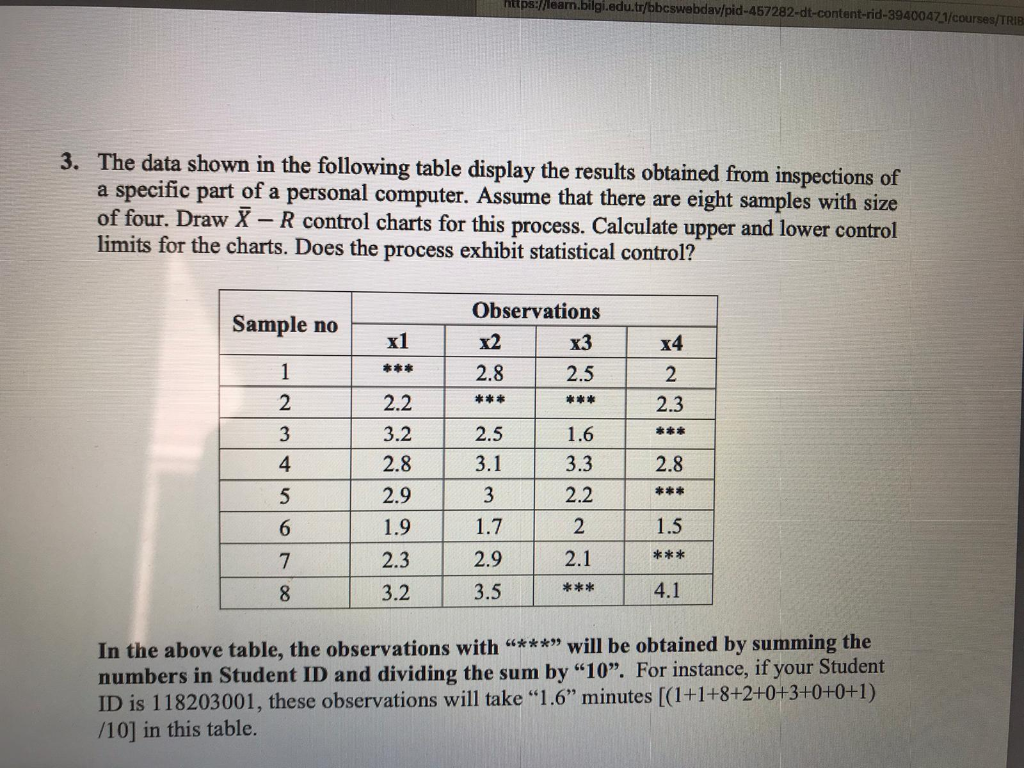
Question: please do NOT solve it with excel https://learn.bilgi.edu.tr/bbcswebdav/pid-457282-dt-content-rid-39400473/courses/TRIB 3. The data shown in the following table display the results obtained from inspections of a specific

please do NOT solve it with excel

please do NOT solve it with excel

https://learn.bilgi.edu.tr/bbcswebdav/pid-457282-dt-content-rid-39400473/courses/TRIB 3. The data shown in the following table display the results obtained from inspections of a specific part of a personal computer. Assume that there are eight samples with size of four. Draw X-R control charts for this process. Calculate upper and lower control limits for the charts. Does the process exhibit statistical control? Sample no Observations x3 2.8 2.5 x1 *** x4 1 2 2.3 2 2.2 *** 3 *** 3.2 2.8 4 2.5 3.1 3 1.7 1.6 3.3 2.2 2.8 5 *** 6 2 1.5 2.9 1.9 2.3 3.2 7 2.9 *** 2.1 **** 8 3.5 4.1 In the above table, the observations with "***" will be obtained by summing the numbers in Student ID and dividing the sum by "10". For instance, if your Student ID is 118203001, these observations will take 1.6" minutes [(1+1+8+2+0+3+0+0+1) /10] in this table

Step by Step Solution

There are 3 Steps involved in it

1 Expert Approved Answer
Step: 1 Unlock blur-text-image
Question Has Been Solved by an Expert!

Get step-by-step solutions from verified subject matter experts

Step: 2 Unlock
Step: 3 Unlock

Students Have Also Explored These Related General Management Questions!