

Question: Please do Requirement 2 alone. Please do Requirement 2 alone. Required: 1. Using the data from 2022 in Gaming Table Cost Data, create an Excel
Please do Requirement 2 alone.
Please do Requirement 2 alone.
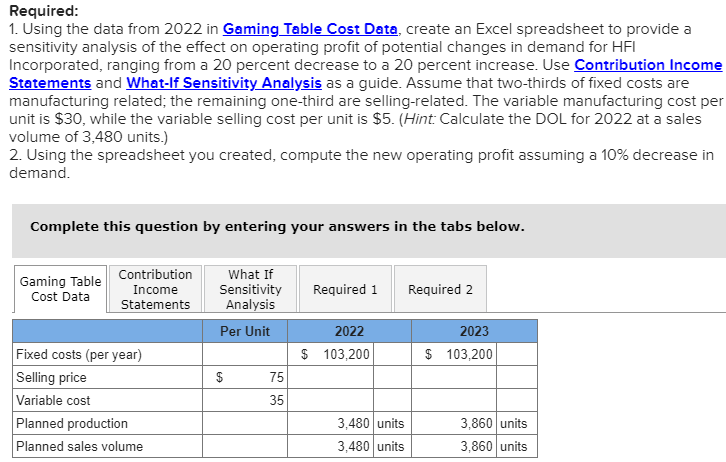
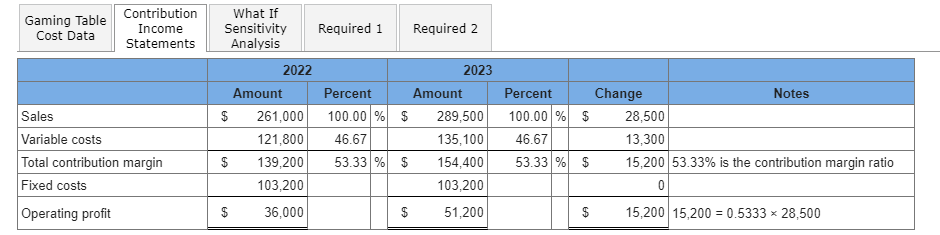
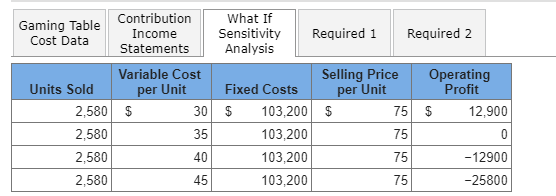
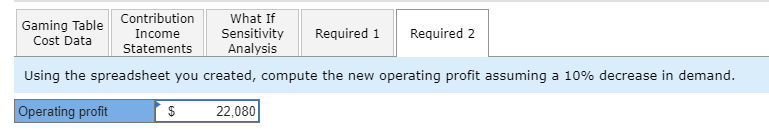
Required: 1. Using the data from 2022 in Gaming Table Cost Data, create an Excel spreadsheet to provide a sensitivity analysis of the effect on operating profit of potential changes in demand for HFI Incorporated, ranging from a 20 percent decrease to a 20 percent increase. Use Contribution Income Statements and What-lf Sensitivity Analysis as a guide. Assume that two-thirds of fixed costs are manufacturing related; the remaining one-third are selling-related. The variable manufacturing cost per unit is $30, while the variable selling cost per unit is $5. (HintCalculate the DOL for 2022 at a sales volume of 3,480 units.) 2. Using the spreadsheet you created, compute the new operating profit assuming a 10% decrease in demand. Complete this question by entering your answers in the tabs below. Gaming Table Cost Data Contribution Income Statements Required 1 Required 2 What If Sensitivity Analysis Per Unit 2022 $ 103,200 2023 $ 103,200 $ 75 Fixed costs (per year) Selling price Variable cost Planned production Planned sales volume 35 3,480 units 3,480 units 3,860 units 3,860 units Gaming Table Cost Data Contribution Income Statements Required 1 Required 2 What If Sensitivity Analysis 2022 Amount $ 261,000 121,800 $ 139,200 103,200 Sales Variable costs Total contribution margin Fixed costs 2023 Percent Amount 100.00 % $ 289,500 46.67 135,100 53.33 % $ 154,400 103,200 Percent Change Notes 100.00 % $ 28,500 46.67 13,300 53.33 % $ 15,200 53.33% is the contribution margin ratio 0 Operating profit $ 36,000 $ 51,200 $ 15,200 15,200 = 0.5333 28,500 X Gaming Table Contribution What If Income Cost Data Sensitivity Required 1 Required 2 Statements Analysis Variable Cost Selling Price Operating Units Sold per Unit Fixed Costs per Unit Profit 2,580 $ 30 $ 103,200 $ 75 $ 12,900 2,580 35 103,200 75 0 2,580 40 103,200 75 -12900 2,580 45 103,200 75 -25800 Gaming Table Contribution What If Cost Data Income Sensitivity Required 1 Required 2 Statements Analysis Using the spreadsheet you created, compute the new operating profit assuming a 10% decrease in demand. Operating profit $ 22,080
Step by Step Solution
There are 3 Steps involved in it

Get step-by-step solutions from verified subject matter experts