

Question: Required: 1. Using the data from 2022 in Gaming Table Cost Data, create an Excel spreadsheet to provide a sensitivity analysis of the effect on
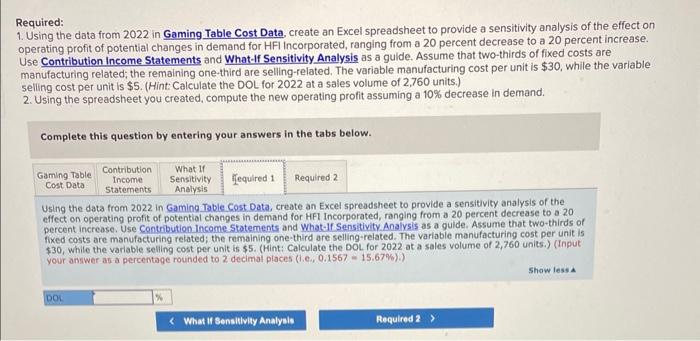
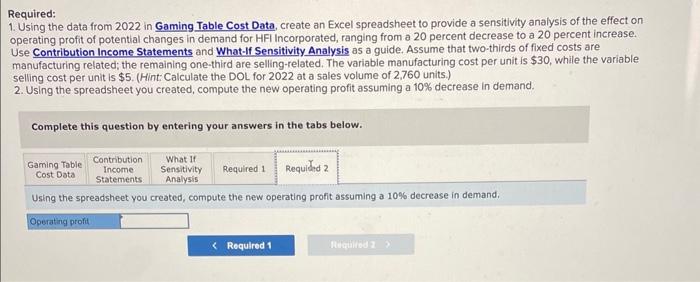
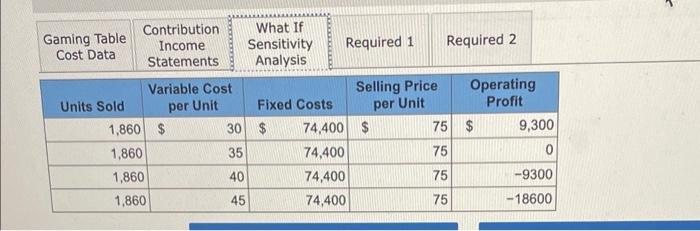
Required: 1. Using the data from 2022 in Gaming Table Cost Data, create an Excel spreadsheet to provide a sensitivity analysis of the effect on operating profit of potential changes in demand for HFI Incorporated, ranging from a 20 percent decrease to a 20 percent increase. Use Contribution Income Statements and What-If Sensitivity Analysis as a gulde. Assume that two-thirds of fixed costs are manufacturing related; the remaining one-third are selling-related. The variable manufacturing cost per unit is $30, while the varlable seliling cost per unit is $5. (Hint: Calculate the DOL for 2022 at a sales volume of 2,760 units.) 2. Using the spreadsheet you created, compute the new operating profit assuming a 10% decrease in demand. Complete this question by entering your answers in the tabs below. Using the data from 2022 in Gaming Table Cost Data, create an Excel spreadsheet to provide a sensitivity analysis of the effect on operating profit of potential changes in demand for HFl incorporated, ranging from a 20 percent decrease to a 20 percent increase. Use Contribution Income Statements and What-if Sensitivity. Analysis as a guide. Assume that two-thirds of fixed costs are manufacturing related; the remaining one-third are selling-related. The variable manufacturing cost per unit is $30, while the variable selling cost per unit is $5. (Hint: Calculate the DOL for 2022 at a sales volume of 2,760 units.) (Input) your answer as a percentage rounded to 2 decimai places (i.e., 0.1567=15.67% ).) Required: 1. Using the data from 2022 in Gaming Table Cost Data, create an Excel spreadsheet to provide a sensitivity analysis of the effect on operating profit of potential changes in demand for HFI Incorporated, ranging from a 20 percent decrease to a 20 percent increase. Use Contribution Income Statements and What-If Sensitivity Analysis as a guide. Assume that two-thirds of fixed costs are manufacturing related; the remaining one-third are selling-related. The variable manufacturing cost per unit is $30, while the variable selling cost per unit is $5. (Hint: Calculate the DOL for 2022 at a sales volume of 2,760 units.) 2. Using the spreadsheet you created, compute the new operating profit assuming a 10% decrease in demand. Complete this question by entering your answers in the tabs below. Using the spreadsheet you created, compute the new operating profit assuming a 10% decrease in demand, Contribution Income Statements > What If Sensitfilty Analysis? \begin{tabular}{:c:c:c:c:c:c} \hline Gaming Table Cost Data & Contribution Income Statements & What If Sensitivity Analysis & Required 1 & Required 2 \\ \hline \end{tabular}
Step by Step Solution
There are 3 Steps involved in it

Get step-by-step solutions from verified subject matter experts