

Question: Please help me solve this Required: 1. Using the data from 2022 in Gaming Table Cost Data, create an Excel spreadsheet to provide a sensitivity
Please help me solve this
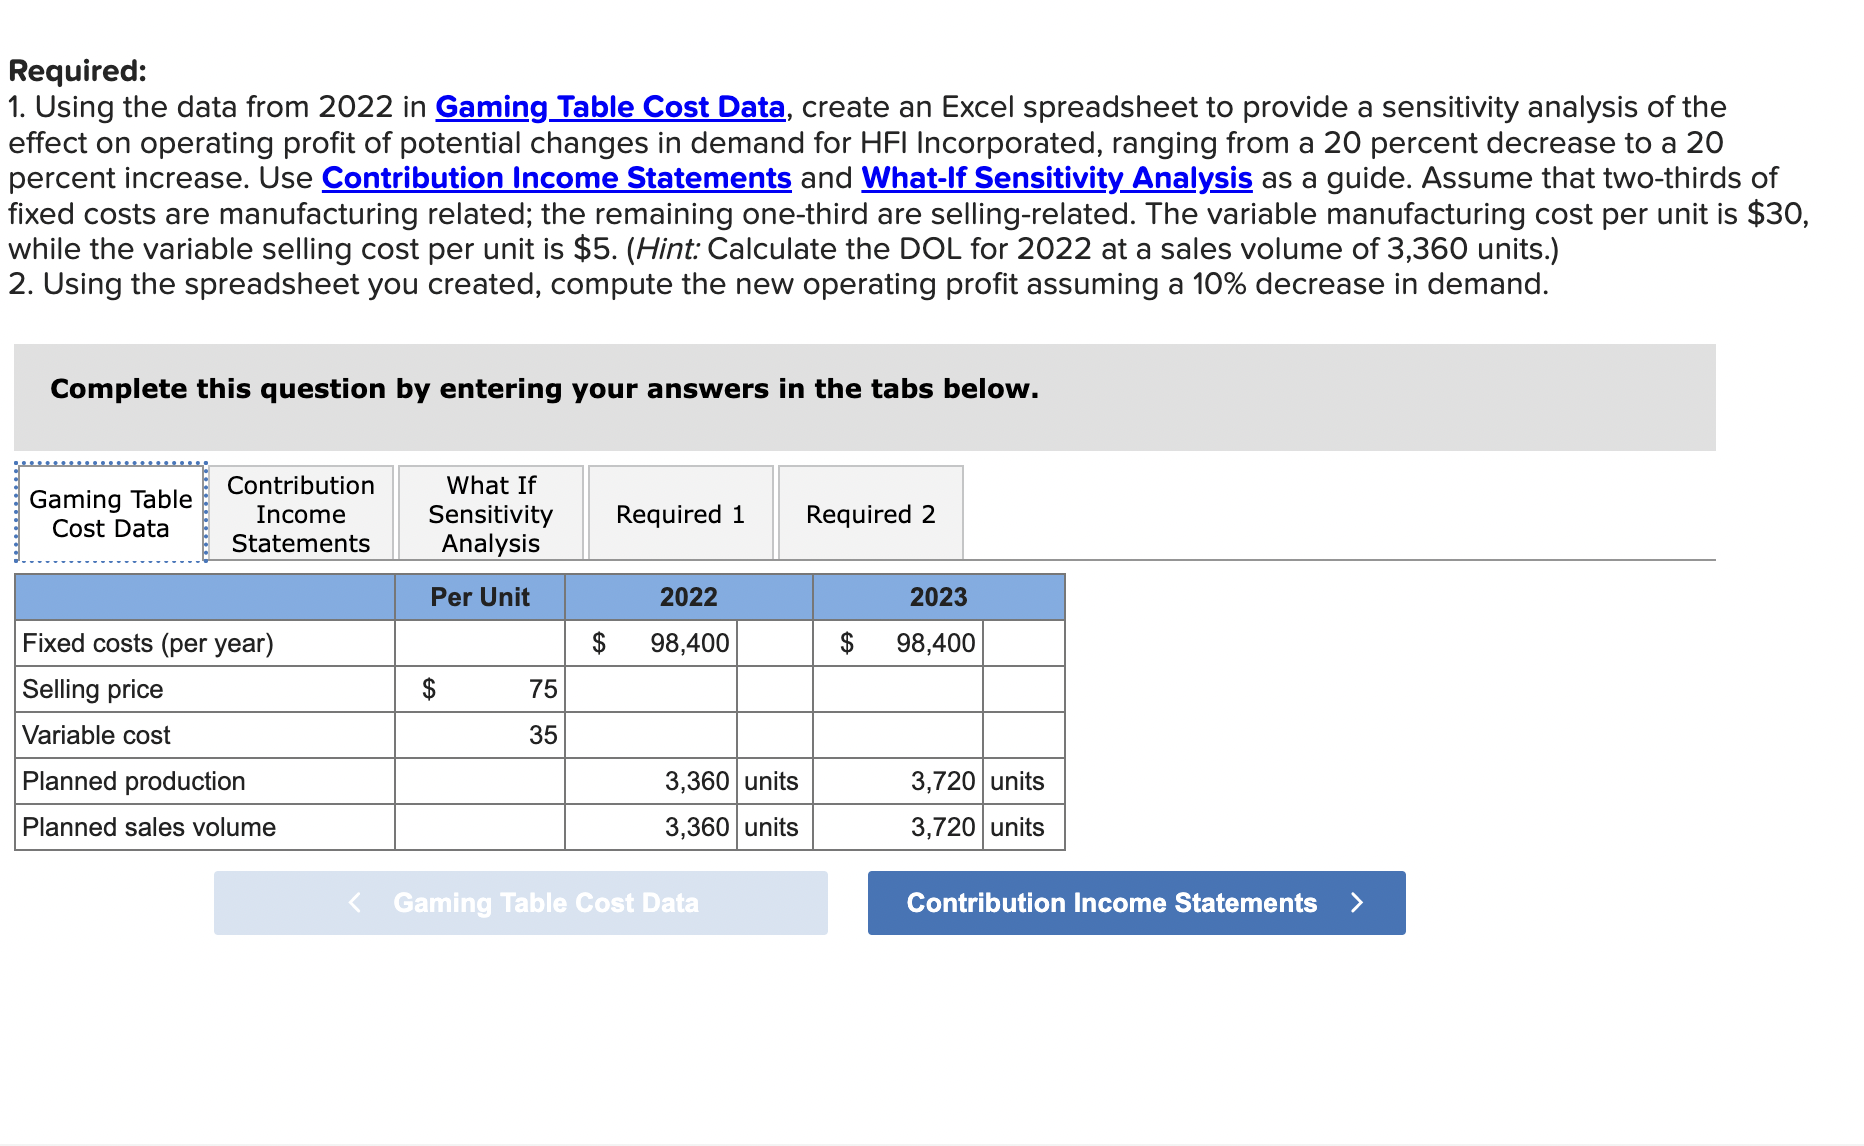
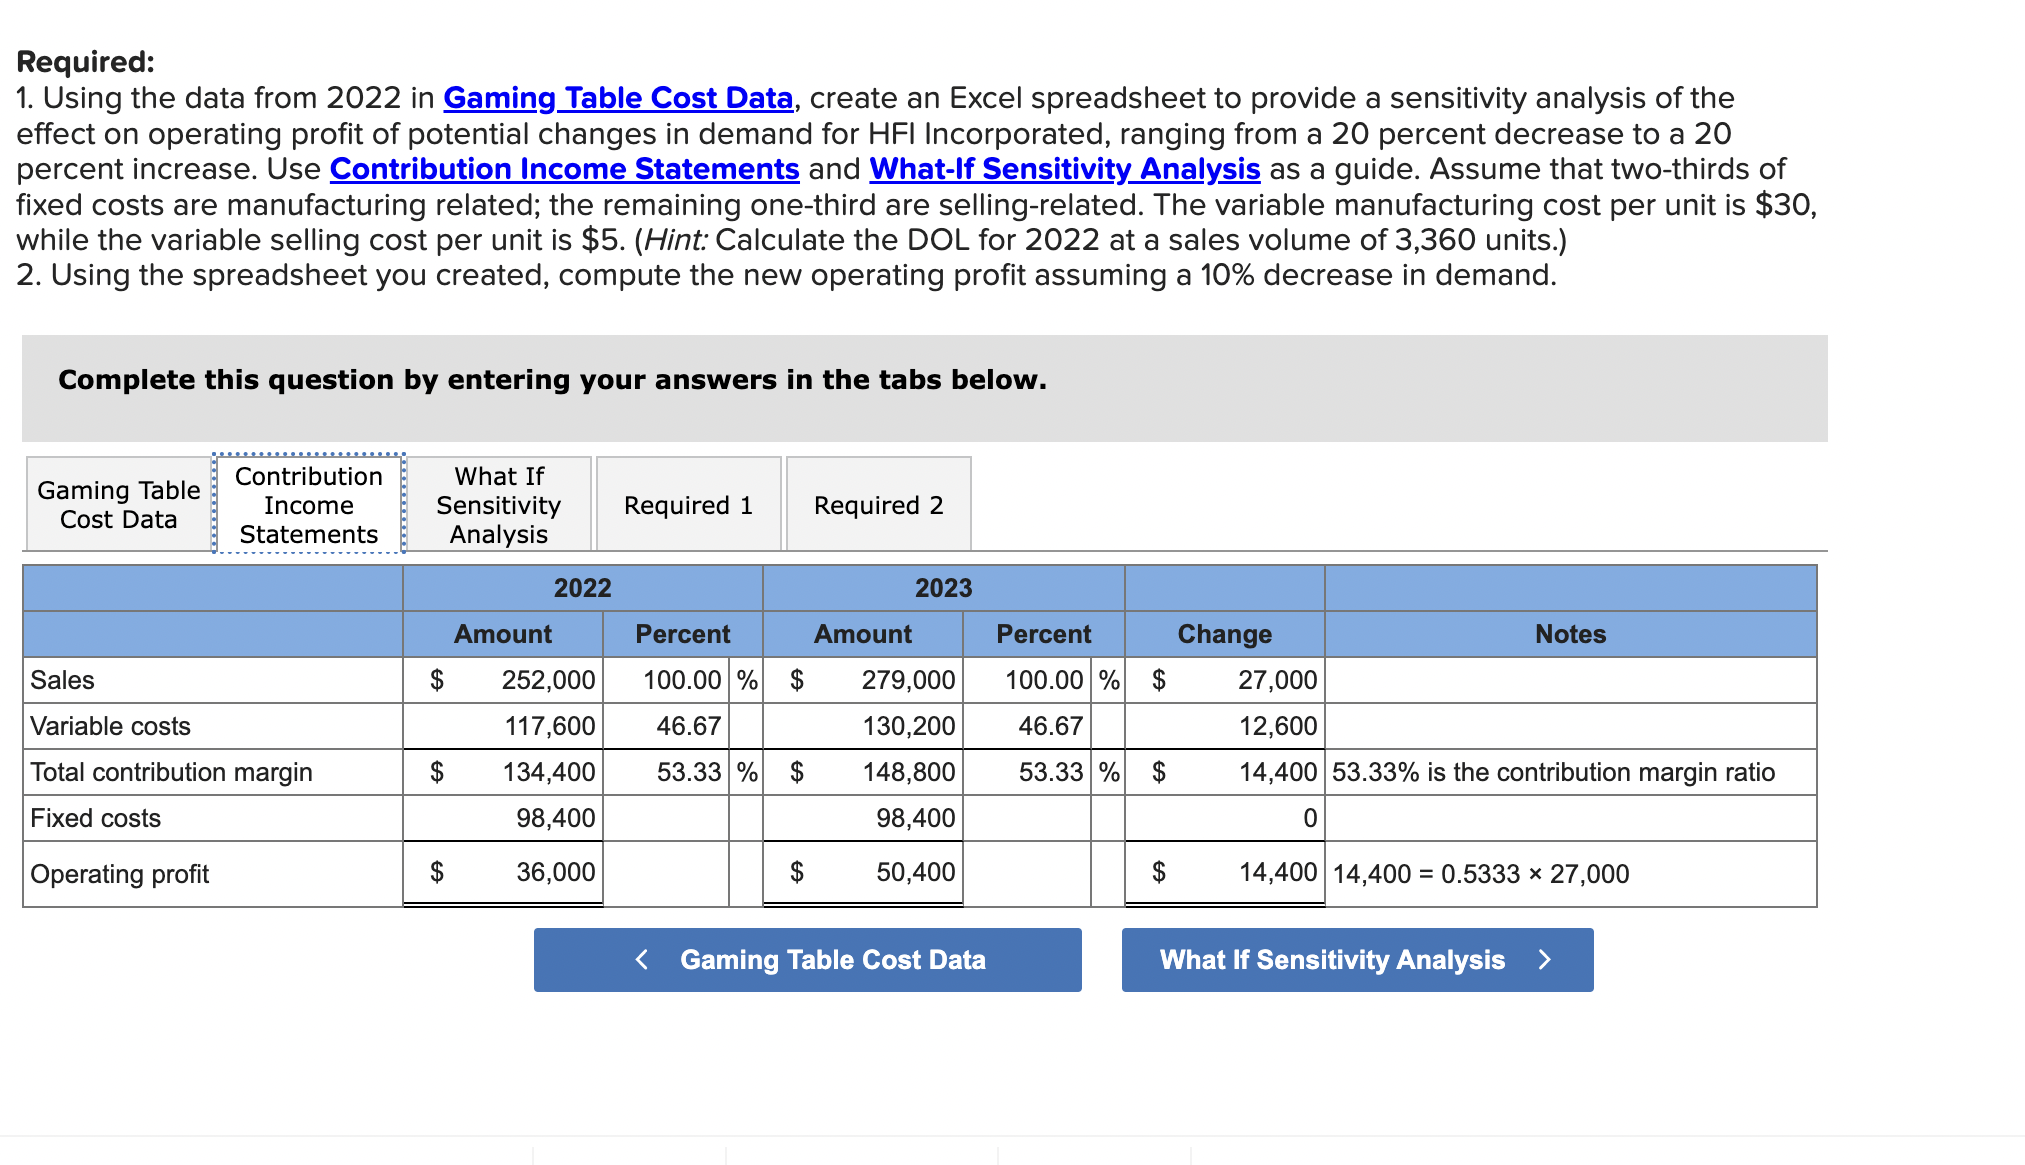
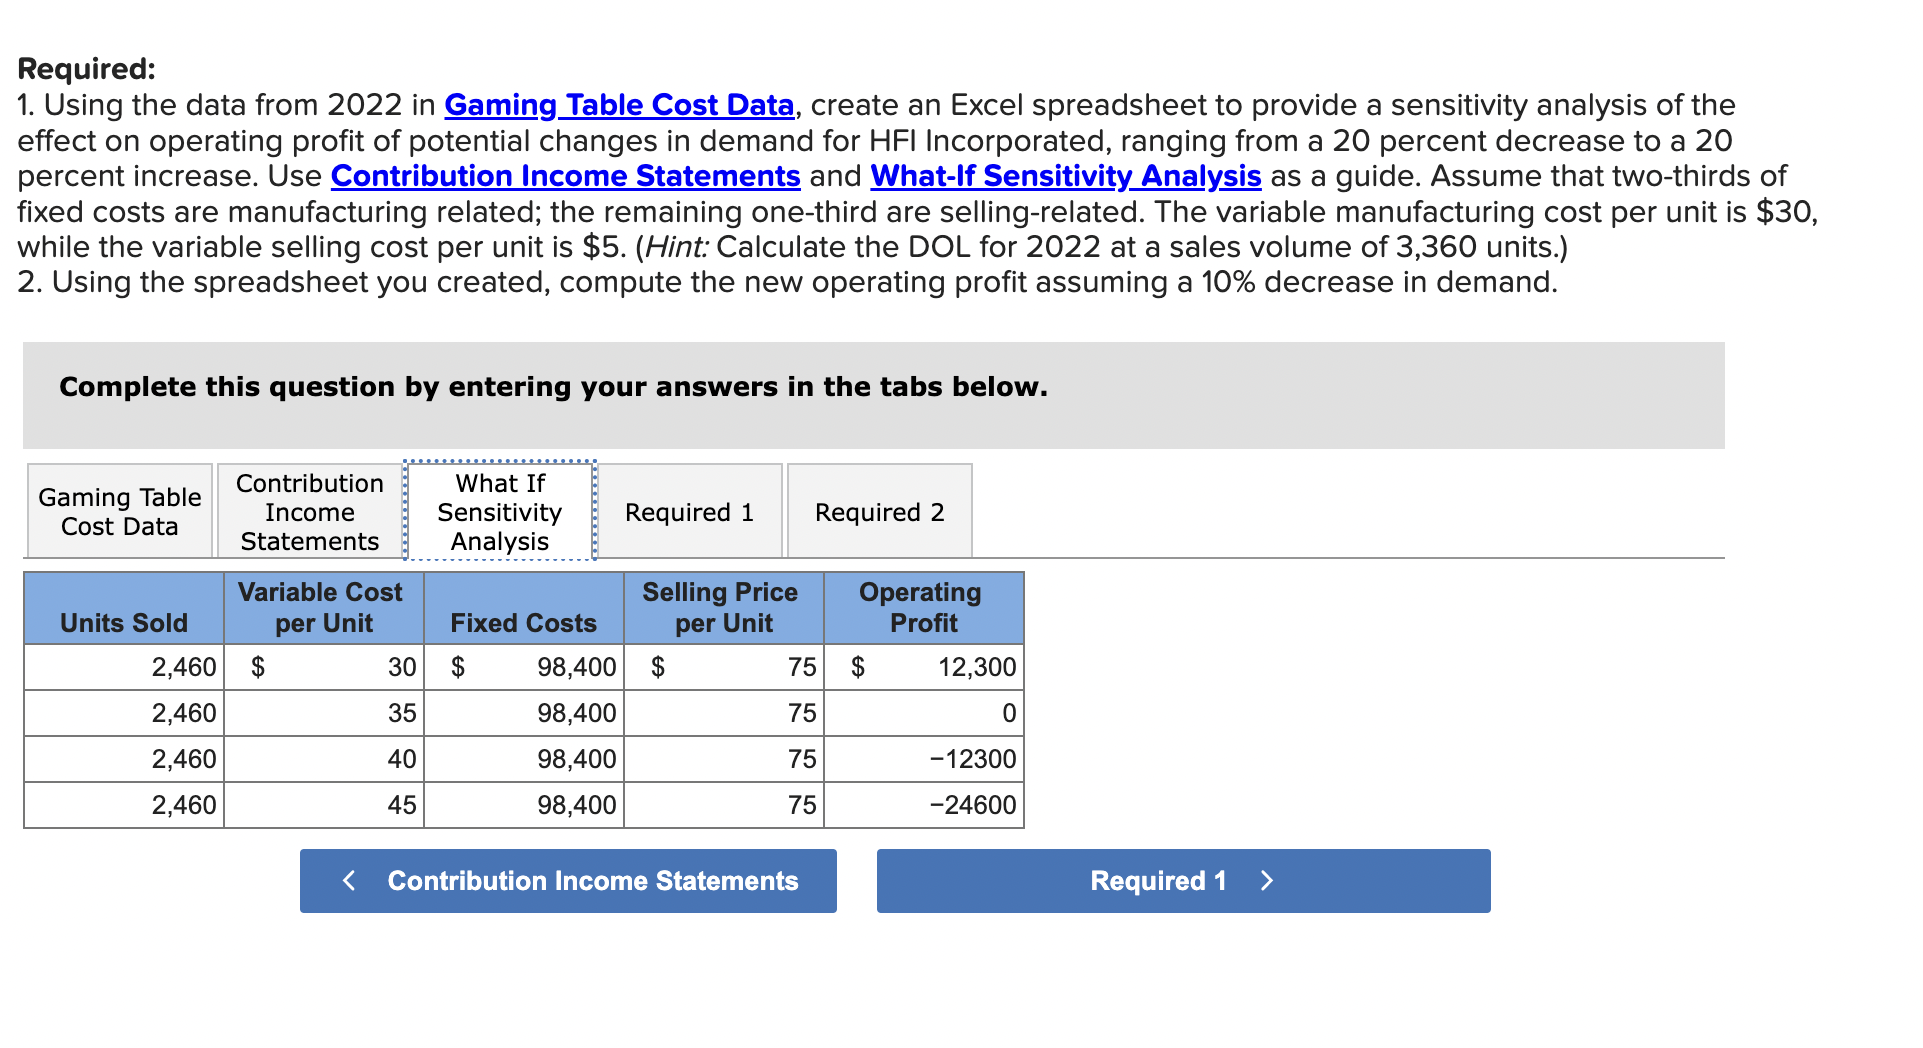
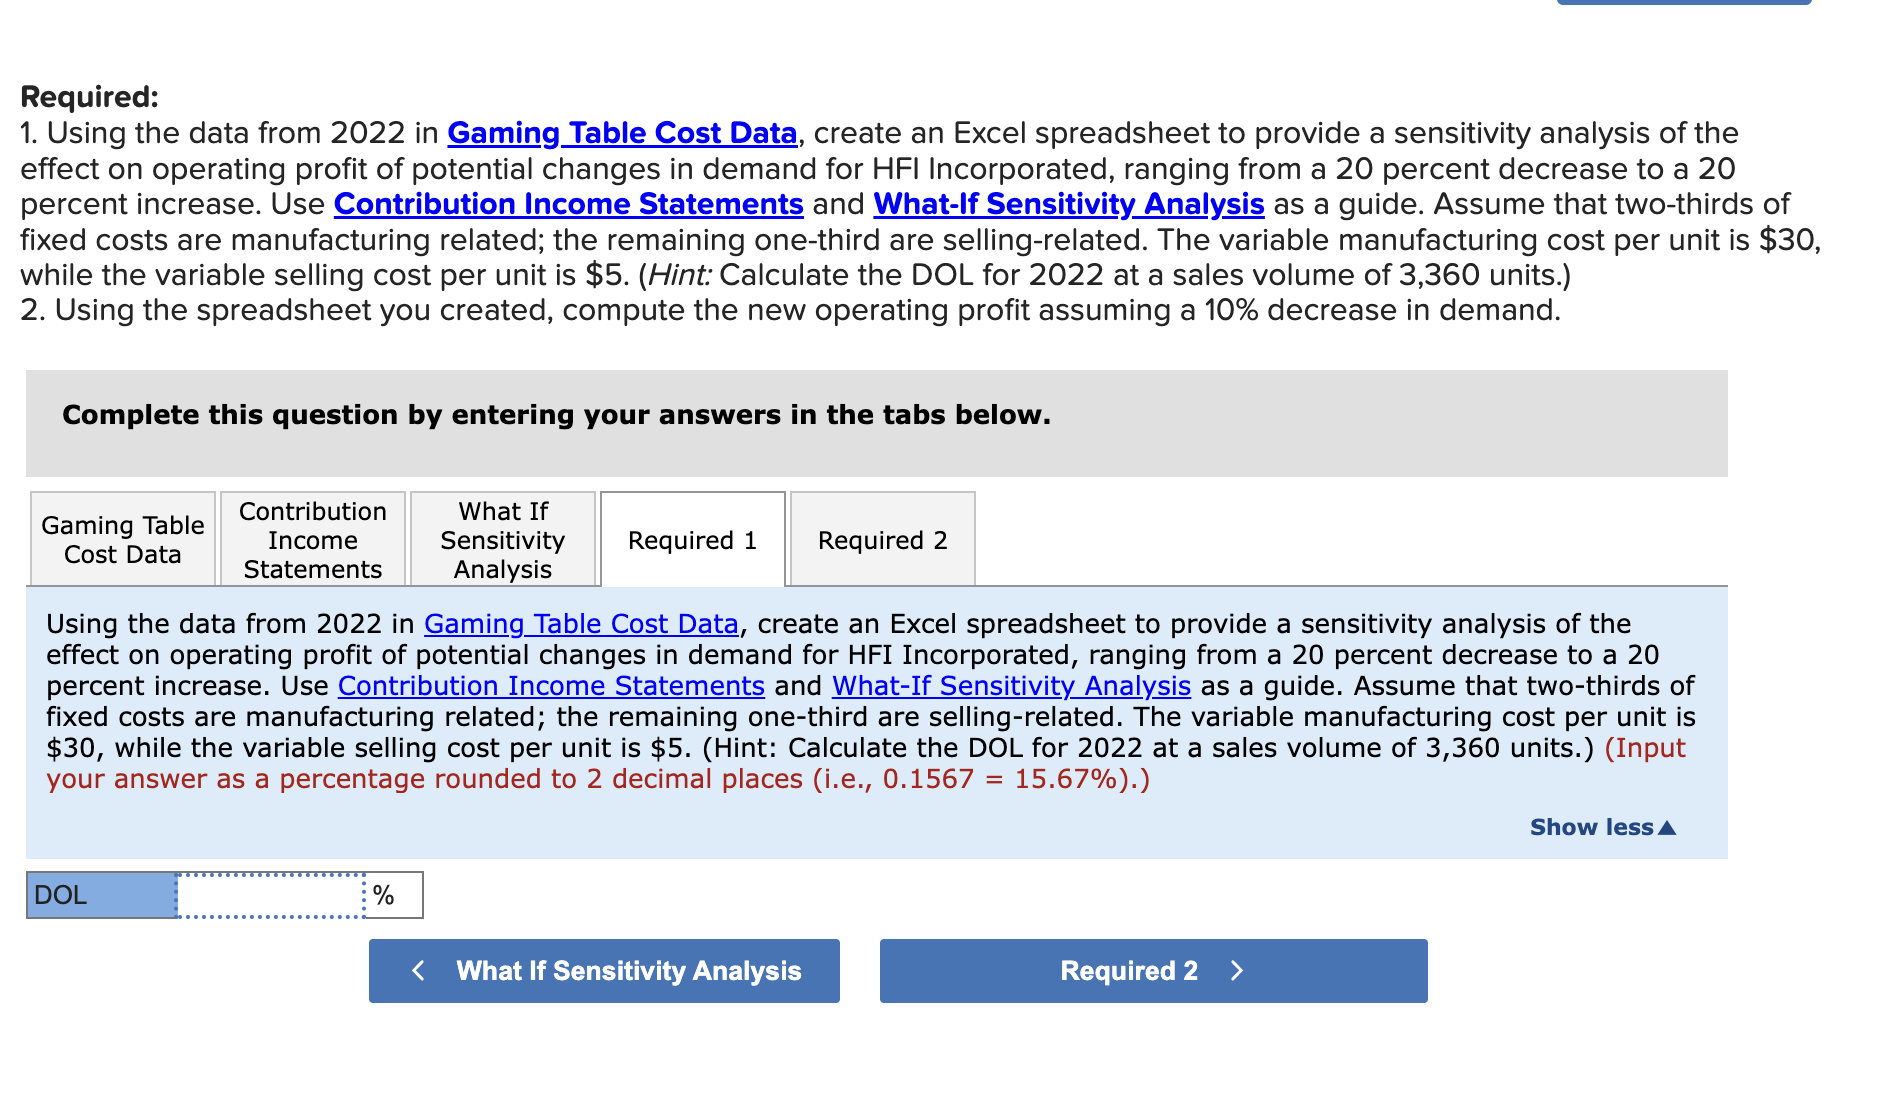
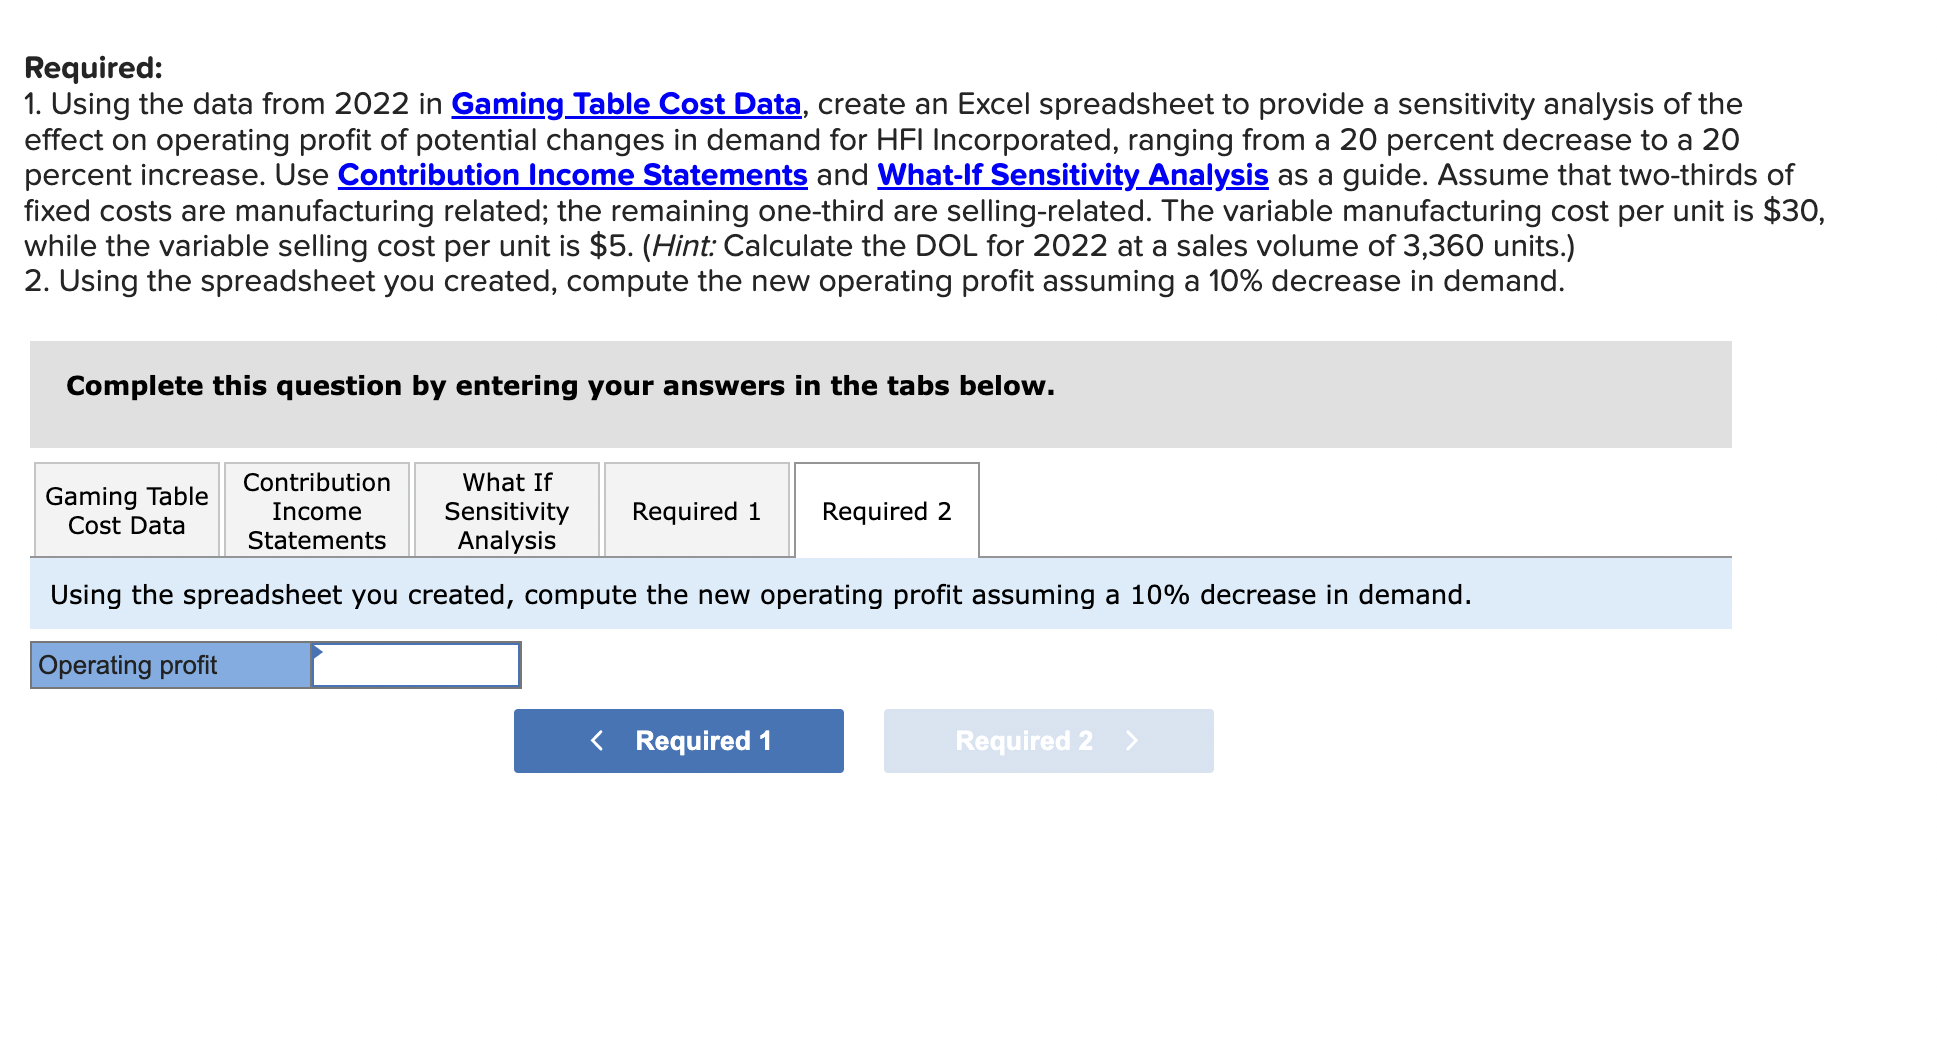
Required: 1. Using the data from 2022 in Gaming Table Cost Data, create an Excel spreadsheet to provide a sensitivity analysis of the effect on operating profit of potential changes in demand for HFI Incorporated, ranging from a 20 percent decrease to a 20 fixed costs are manufacturing related; the remaining one-third are selling-related. The variable manufacturing cost per unit is $30, while the variable selling cost per unit is $5. (Hint: Calculate the DOL for 2022 at a sales volume of 3,360 units.) 2. Using the spreadsheet you created, compute the new operating profit assuming a 10% decrease in demand. Complete this question by entering your answers in the tabs below. Required: 1. Using the data from 2022 in Gaming Table Cost Data, create an Excel spreadsheet to provide a sensitivity analysis of the effect on operating profit of potential changes in demand for HFI Incorporated, ranging from a 20 percent decrease to a 20 percent increase. Use Contribution Income Statements and What-If Sensitivity Analysis as a guide. Assume that two-thirds of ixed costs are manufacturing related; the remaining one-third are selling-related. The variable manufacturing cost per unit is $30, while the variable selling cost per unit is \$5. (Hint: Calculate the DOL for 2022 at a sales volume of 3,360 units.) 2. Using the spreadsheet you created, compute the new operating profit assuming a 10% decrease in demand. Complete this question by entering your answers in the tabs below. Required: 1. Using the data from 2022 in Gaming Table Cost Data, create an Excel spreadsheet to provide a sensitivity analysis of the effect on operating profit of potential changes in demand for HFI Incorporated, ranging from a 20 percent decrease to a 20 percent increase. Use Contribution Income Statements and What-If Sensitivity Analysis as a guide. Assume that two-thirds of fixed costs are manufacturing related; the remaining one-third are selling-related. The variable manufacturing cost per unit is $30, while the variable selling cost per unit is \$5. (Hint: Calculate the DOL for 2022 at a sales volume of 3,360 units.) 2. Using the spreadsheet you created, compute the new operating profit assuming a 10% decrease in demand. Complete this question by entering your answers in the tabs below. Required: 1. Using the data from 2022 in Gaming Table Cost Data, create an Excel spreadsheet to provide a sensitivity analysis of the effect on operating profit of potential changes in demand for HFI Incorporated, ranging from a 20 percent decrease to a 20 fixed costs are manufacturing related; the remaining one-third are selling-related. The variable manufacturing cost per unit is $. while the variable selling cost per unit is \$5. (Hint: Calculate the DOL for 2022 at a sales volume of 3,360 units.) 2. Using the spreadsheet you created, compute the new operating profit assuming a 10% decrease in demand. Complete this question by entering your answers in the tabs below. Using the data from 2022 in Gaming Table Cost Data, create an Excel spreadsheet to provide a sensitivity analysis of the effect on operating profit of potential changes in demand for HFI Incorporated, ranging from a 20 percent decrease to a 20 percent increase. Use Contribution Income Statements and What-If Sensitivity Analysis as a guide. Assume that two-thirds of fixed costs are manufacturing related; the remaining one-third are selling-related. The variable manufacturing cost per unit is $30, while the variable selling cost per unit is $5. (Hint: Calculate the DOL for 2022 at a sales volume of 3,360 units.) (Input your answer as a percentage rounded to 2 decimal places (i.e., 0.1567=15.67% ).) Required: 1. Using the data from 2022 in Gaming Table Cost Data, create an Excel spreadsheet to provide a sensitivity analysis of the effect on operating profit of potential changes in demand for HFI Incorporated, ranging from a 20 percent decrease to a 20 percent increase. Use Contribution Income Statements and What-If Sensitivity Analysis as a guide. Assume that two-thirds of fixed costs are manufacturing related; the remaining one-third are selling-related. The variable manufacturing cost per unit is $30, while the variable selling cost per unit is $5. (Hint: Calculate the DOL for 2022 at a sales volume of 3,360 units.) 2. Using the spreadsheet you created, compute the new operating profit assuming a 10% decrease in demand. Complete this question by entering your answers in the tabs below. Using the spreadsheet you created, compute the new operating profit assuming a 10% decrease in demand
Step by Step Solution
There are 3 Steps involved in it
To solve this problem well follow these steps Step 1 Calculate the Degree of Operating Leverage DOL ... View full answer

Get step-by-step solutions from verified subject matter experts