

Question: Please do this and show the steps so I can practice Data Analysis Questions: Calculate the moving averages for each observation in the data based
Please do this and show the steps so I can practice
Data Analysis Questions:
- Calculate the moving averages for each observation in the data based on periods 1, 2, 3, and 4. It should be centered on periodt= 2.
Use the function of =AVERAGE (D2:D5) in cell E3 and copy the formula down to cell E30.
Show the moving averages plotted on the passenger series y(t). Do not forget to label x and y axes and adjust the values on the plot using Figure1.
Show your plot space provided below:
2. The second step of averaging the averages is only necessary when the number of seasons is even, as with semiannual, quarterly, or monthly data. However, if the number of seasons is odd, then the initial moving average is the centered moving average. This average is referred to ascentered moving average (CMA).
- Calculate the centered moving average (CMA) that will be centered ont= 3.
This value can be seen in the spreadsheet and was obtained by entering = AVERAGE (E3:E4) in cell F4. This first centered moving average is properly sitting ont= 3. The remaining centered moving averages can be found by copying the formula in cellF4 down to cell F30.
Show the centered moving averages plotted on the passenger series y(t) and compare and interpret the trend of two series. Do not forget to label x and y axes and adjust the values on the plot using Figure 1.
Show your plot space provided below:
3. Now you have an appropriate baseline estimate for the level of the process historically, so you can compute the seasonal component. This seasonal ratio says that we can isolate the seasonal component by dividing the data by the level of series as estimated by the trend component.
- Calculateseasonal ratio for the passenger series y(t). The basic idea behind seasonal ratios can be seen by rearranging the trend-times-seasonal model:


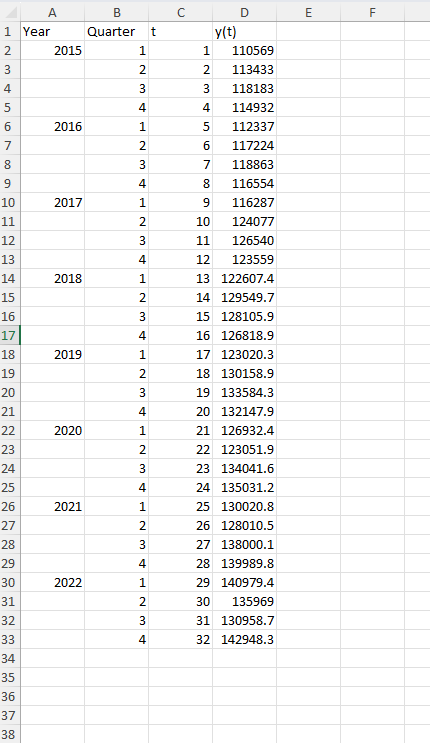
\f\f\fA B D E F Year Quarter y(t) 2015 1 110569 2 2 113433 4 3 3 118183 4 4 114932 6 2016 1 5 112337 7 2 6 117224 8 3 7 118863 LD 4 8 116554 10 2017 1 9 116287 11 2 10 124077 12 3 11 126540 13 4 12 123559 14 2018 1 13 122607.4 15 2 14 129549.7 16 3 15 128105.9 17 4 16 126818.9 18 2019 1 17 123020.3 19 2 18 130158.9 20 3 19 133584.3 21 4 20 132147.9 22 2020 1 21 126932.4 23 2 22 123051.9 24 3 23 134041.6 25 4 24 135031.2 26 2021 1 25 130020.8 27 2 26 128010.5 28 3 27 138000.1 29 4 28 139989.8 30 2022 29 140979.4 31 2 30 135969 32 3 31 130958.7 33 4 32 142948.3 34 35 36 37 38
Step by Step Solution
There are 3 Steps involved in it

Get step-by-step solutions from verified subject matter experts