

Question: The following data represents students grades in grade 12 math: 93 85 79 60 Calculate the 95 percent confidence interval for u 80 Calculate the
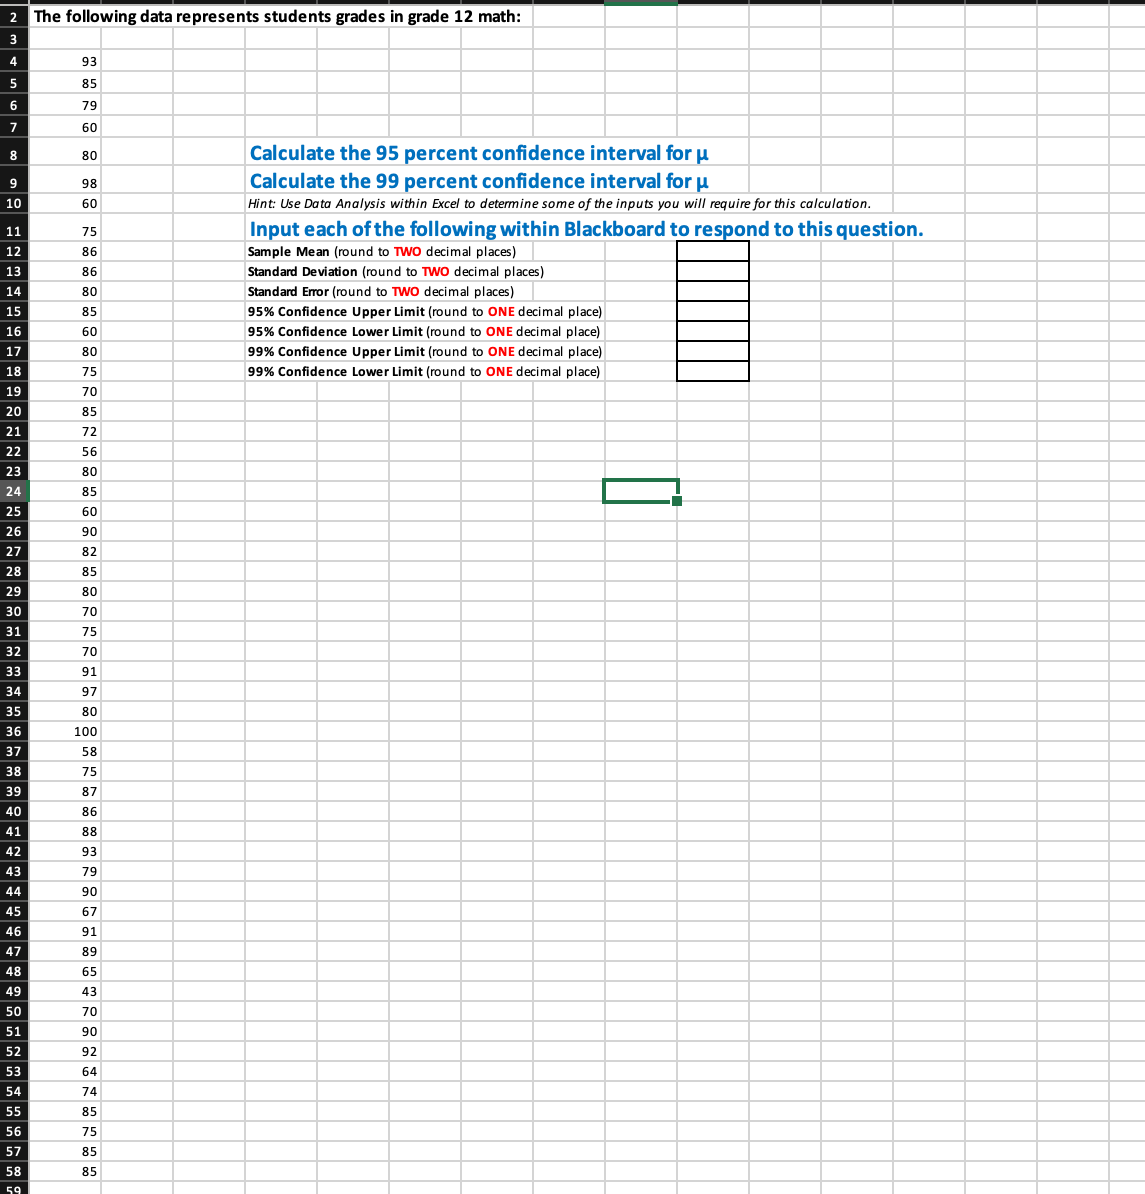
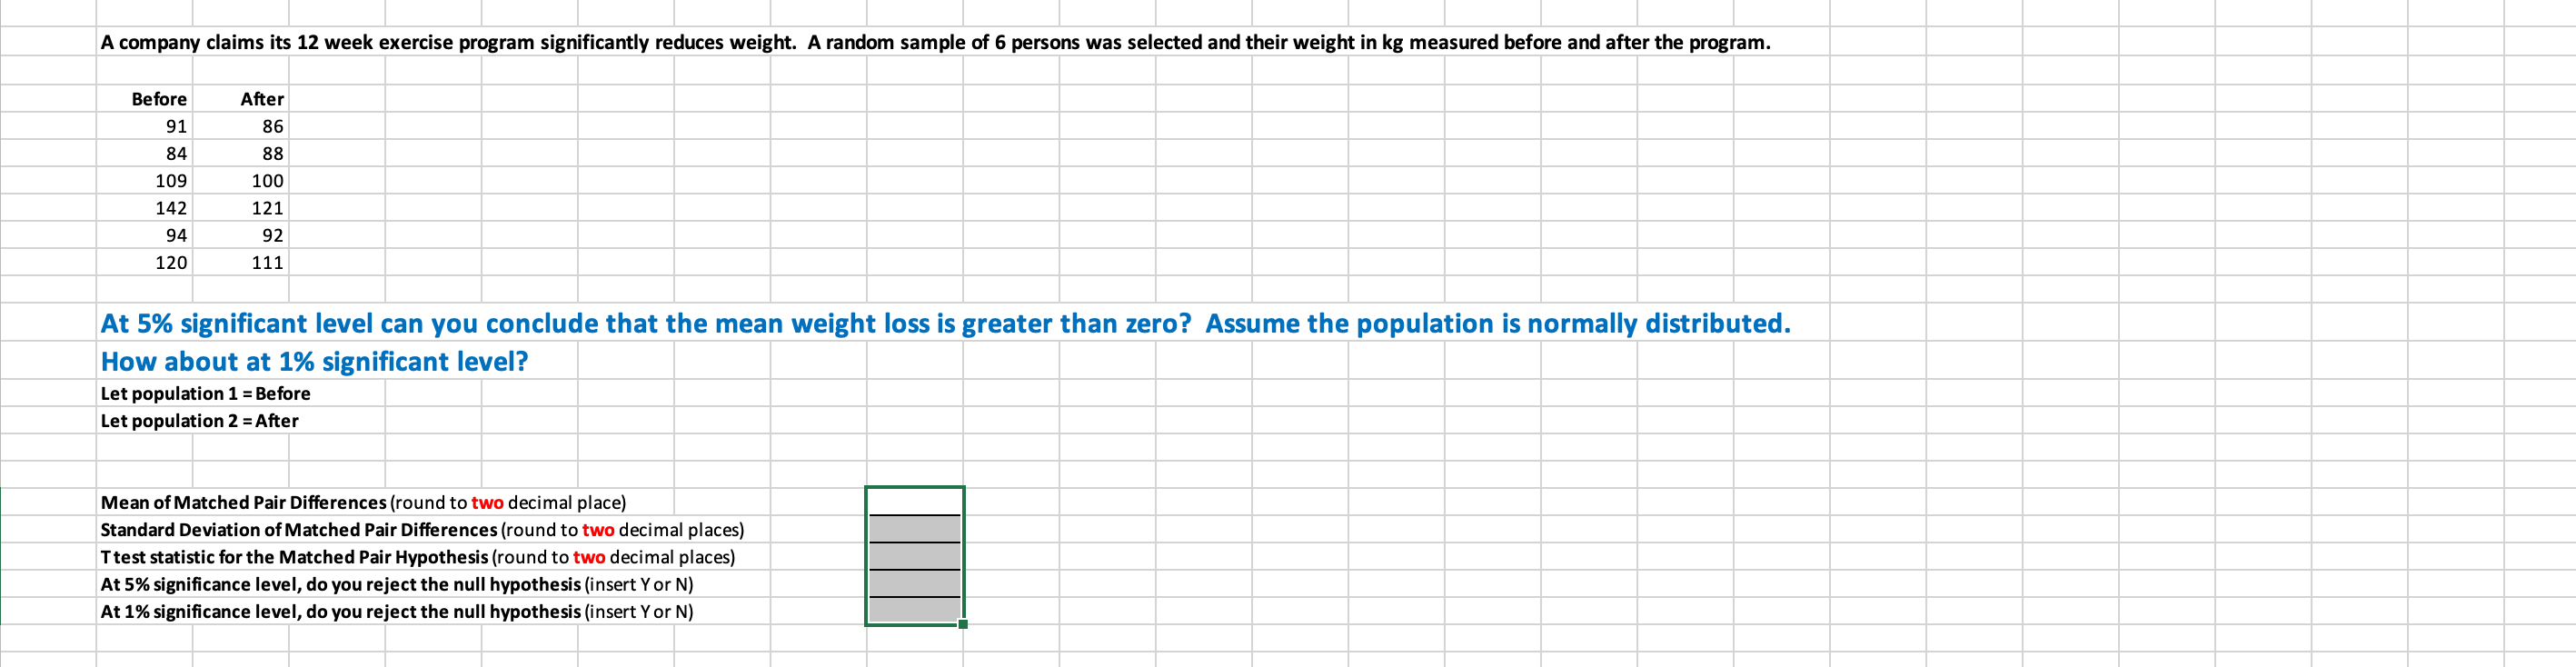
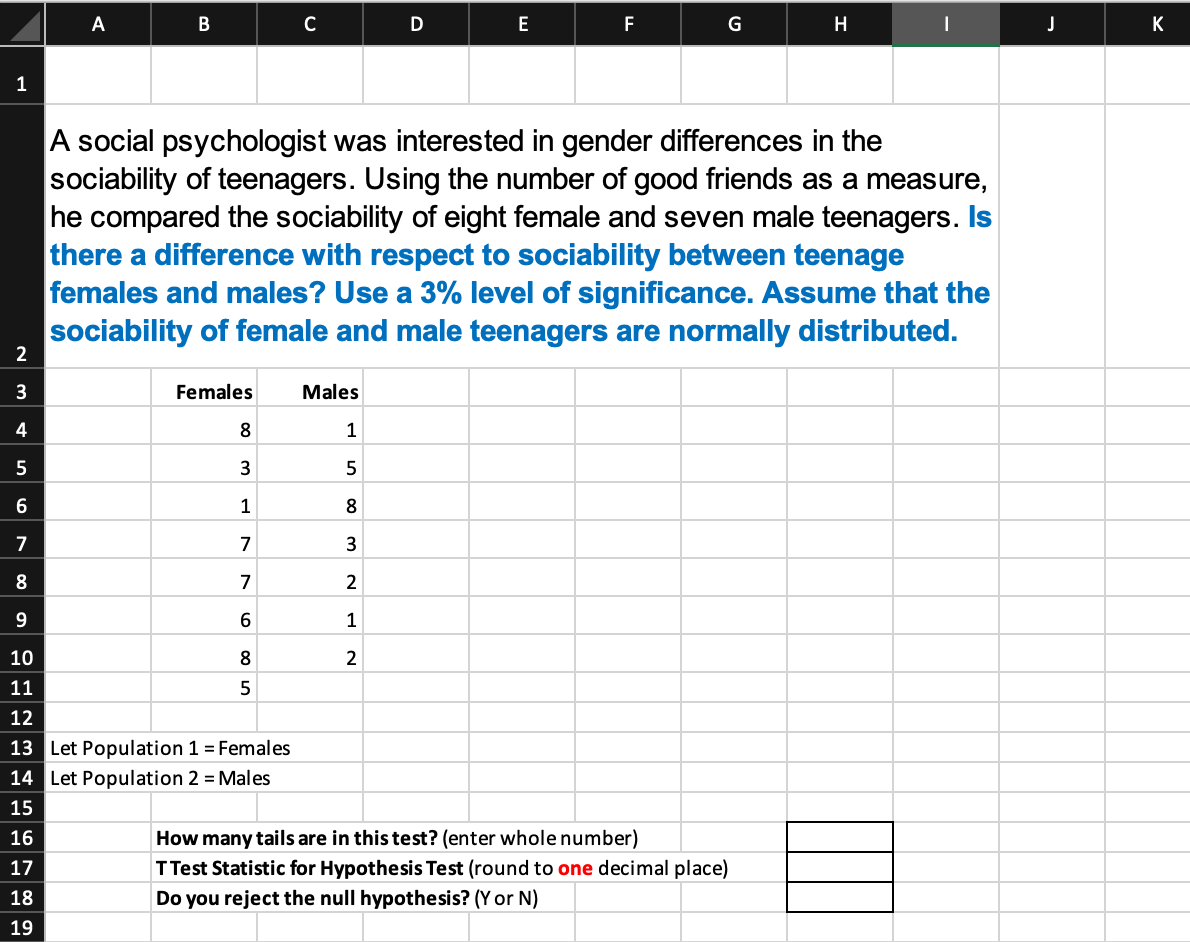
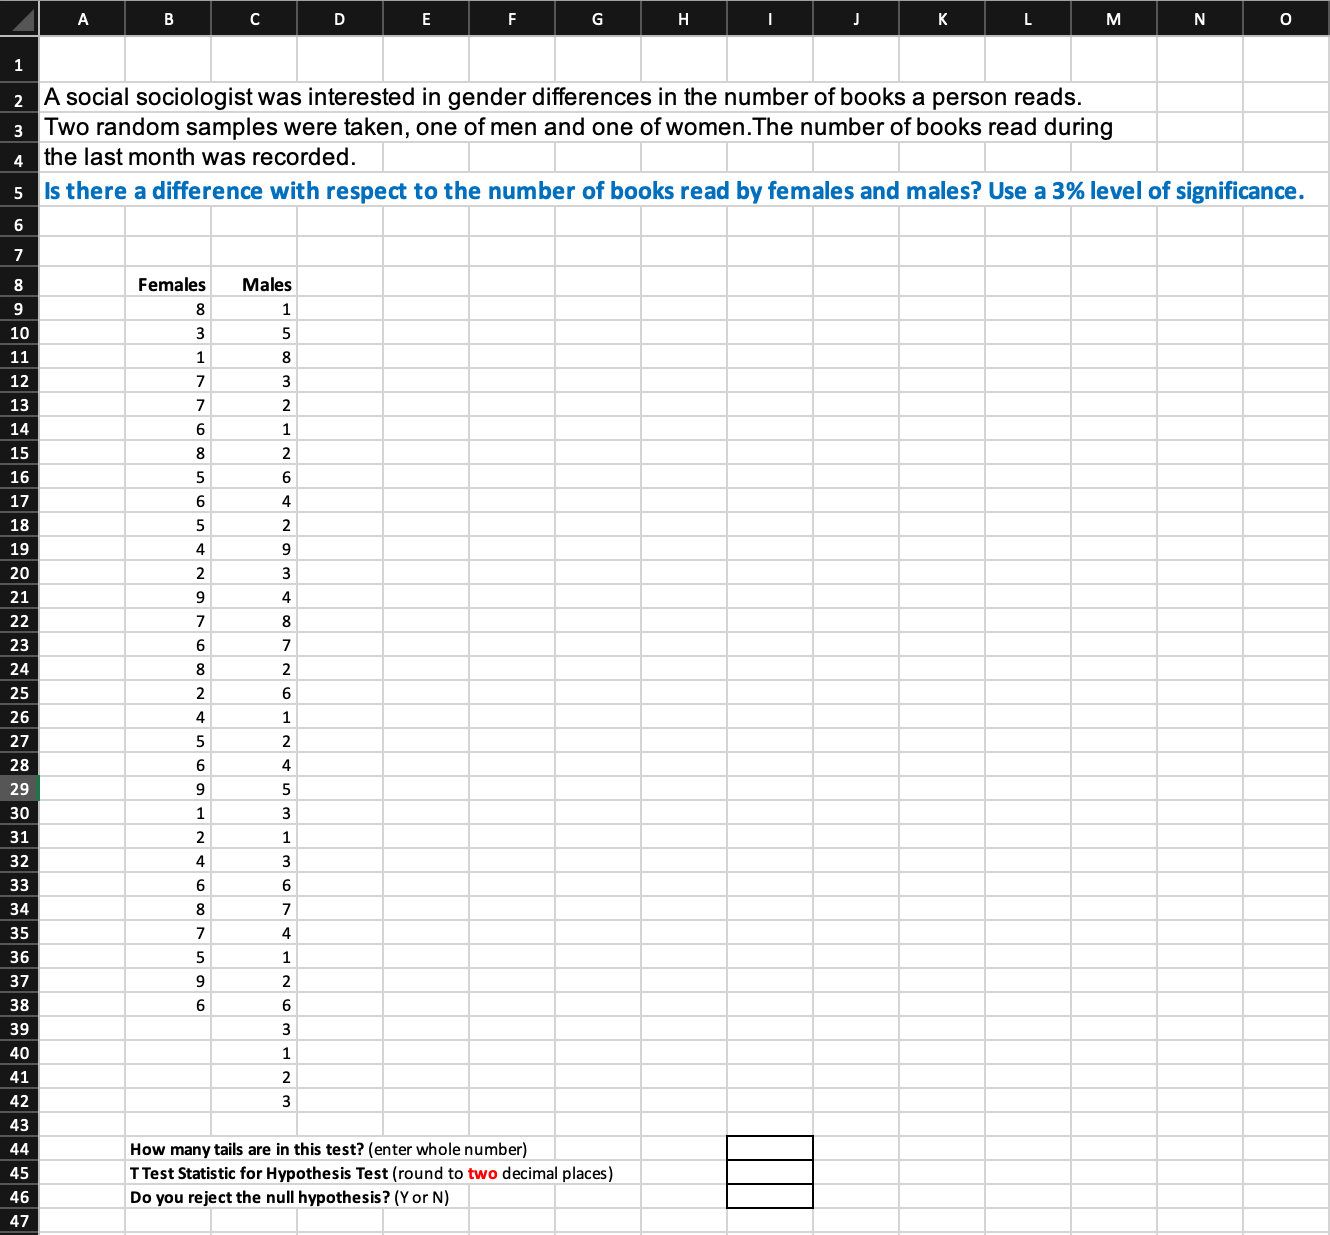
The following data represents students grades in grade 12 math: 93 85 79 60 Calculate the 95 percent confidence interval for u 80 Calculate the 99 percent confidence interval for u 98 Hint: Use Data Analysis within Excel to determine some of the inputs you will require for this calculation. 10 60 Input each of the following within Blackboard to respond to this question. 75 Sample Mean (round to TWO decimal places) 86 Standard Deviation (round to TWO decimal places) 86 Standard Error (round to TWO decimal places) 80 95% Confidence Upper Limit (round to ONE decimal place) 85 95% Confidence Lower Limit (round to ONE decimal place) 60 99% Confidence Upper Limit (round to ONE decimal place) 80 99% Confidence Lower Limit (round to ONE decimal place) 75 70 85 72 56 80 85 60 90 82 85 80 70 75 70 91 80A company claims its 12 week exercise program significantly reduces weight. A random sample of 6 persons was selected and their weight in kg measured before and after the program. Before After 91 86 84 88 109 100 142 121 94 92 120 111 At 5% significant level can you conclude that the mean weight loss is greater than zero? Assume the population is normally distributed. How about at 1% significant level? Let population 1 = Before Let population 2 = After Mean of Matched Pair Differences (round to two decimal place) Standard Deviation of Matched Pair Differences (round to two decimal places) T test statistic for the Matched Pair Hypothesis (round to two decimal places) At 5% significance level, do you reject the null hypothesis (insert Y or N) At 1% significance level, do you reject the null hypothesis (insert Y or N)A B C D E F G H K A social psychologist was interested in gender differences in the sociability of teenagers. Using the number of good friends as a measure, he compared the sociability of eight female and seven male teenagers. Is there a difference with respect to sociability between teenage females and males? Use a 3% level of significance. Assume that the sociability of female and male teenagers are normally distributed. 2 3 Females Males 4 8 1 5 W 5 6 8 W 8 2 9 6 10 8 2 11 12 3 Let Population 1 = Females 14 Let Population 2 = Males 15 16 How many tails are in this test? (enter whole number) 17 T Test Statistic for Hypothesis Test (round to one decimal place) 8T Do you reject the null hypothesis? (Y or N) 19B E G H M N O 1 A social sociologist was interested in gender differences in the number of books a person reads. 3 Two random samples were taken, one of men and one of women. The number of books read during the last month was recorded. Is there a difference with respect to the number of books read by females and males? Use a 3% level of significance. 00 Females Males 9 10 W N H W O N H A V O W H W U A N H O N V O A W U N A O N H N W OOUT How many tails are in this test? (enter whole number) T Test Statistic for Hypothesis Test (round to two decimal places) Do you reject the null hypothesis? (Y or N)
Step by Step Solution
There are 3 Steps involved in it

Get step-by-step solutions from verified subject matter experts