

Question: Please draw a graph and explain the question with this graph. Thank you. The solute A is being absorbed from a gas mixture of A
 Please draw a graph and explain the question with this graph. Thank you.
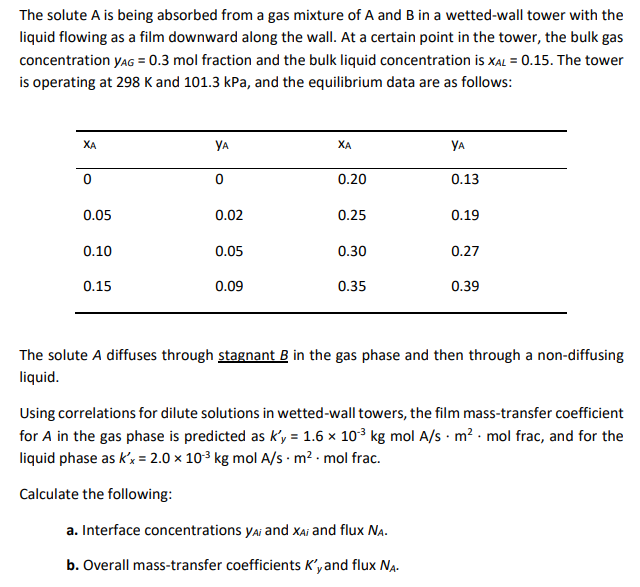
The solute A is being absorbed from a gas mixture of A and B in a wetted-wall tower with the liquid flowing as a film downward along the wall. At a certain point in the tower, the bulk gas concentration yag = 0.3 mol fraction and the bulk liquid concentration is XAL = 0.15. The tower is operating at 298 K and 101.3 kPa, and the equilibrium data are as follows: XA YA XA YA 0 0 0.20 0.13 0.05 0.02 0.25 0.19 0.10 0.05 0.30 0.27 0.15 0.09 0.35 0.39 The solute A diffuses through stagnant B in the gas phase and then through a non-diffusing liquid. Using correlations for dilute solutions in wetted-wall towers, the film mass-transfer coefficient for A in the gas phase is predicted as ky = 1.6 x 10 kg mol A/s. m2. mol frac, and for the liquid phase as k'x = 2.0 x 10³ kg mol A/s. m2. mol frac. Calculate the following: a. Interface concentrations yai and Xai and flux NA. b. Overall mass-transfer coefficients K'y and flux Na
Step by Step Solution
There are 3 Steps involved in it

Get step-by-step solutions from verified subject matter experts