

Question: Please Draw Confidence Interval diagram and explain. For a normal population with known variance o?, what is the confidence level for the Cl-(include the confidence
Please Draw Confidence Interval diagram and explain.
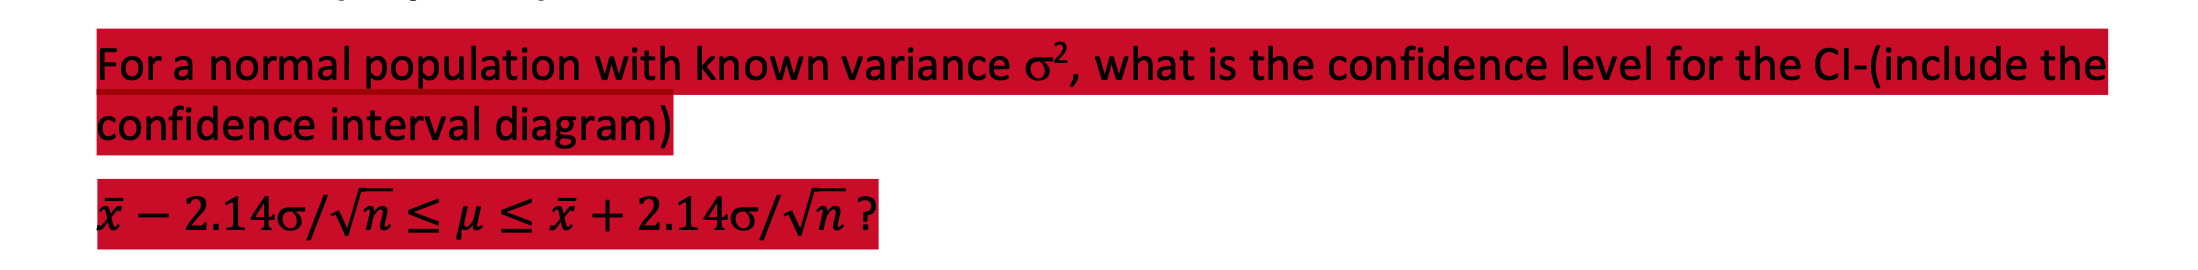
For a normal population with known variance o?, what is the confidence level for the Cl-(include the confidence interval diagram x - 2.140/Vn
Step by Step Solution
There are 3 Steps involved in it
1 Expert Approved Answer
Step: 1 Unlock

Question Has Been Solved by an Expert!
Get step-by-step solutions from verified subject matter experts
Step: 2 Unlock
Step: 3 Unlock