

Question: Please draw the t vs X graph and show its constant and falling rate periods and draw the X vs R graph and show its
Please draw the t vs X graph and show its constant and falling rate periods and draw the X vs R graph and show its constant and falling rate periods. Show the critical moisture content (Xc) and equilibrium moisture content (Xe) on it. Please draw the t vs ln(X* ) graph and obtain its equation. Use this equation to calculate the diffusion coefficient (D) for the carrot slice.
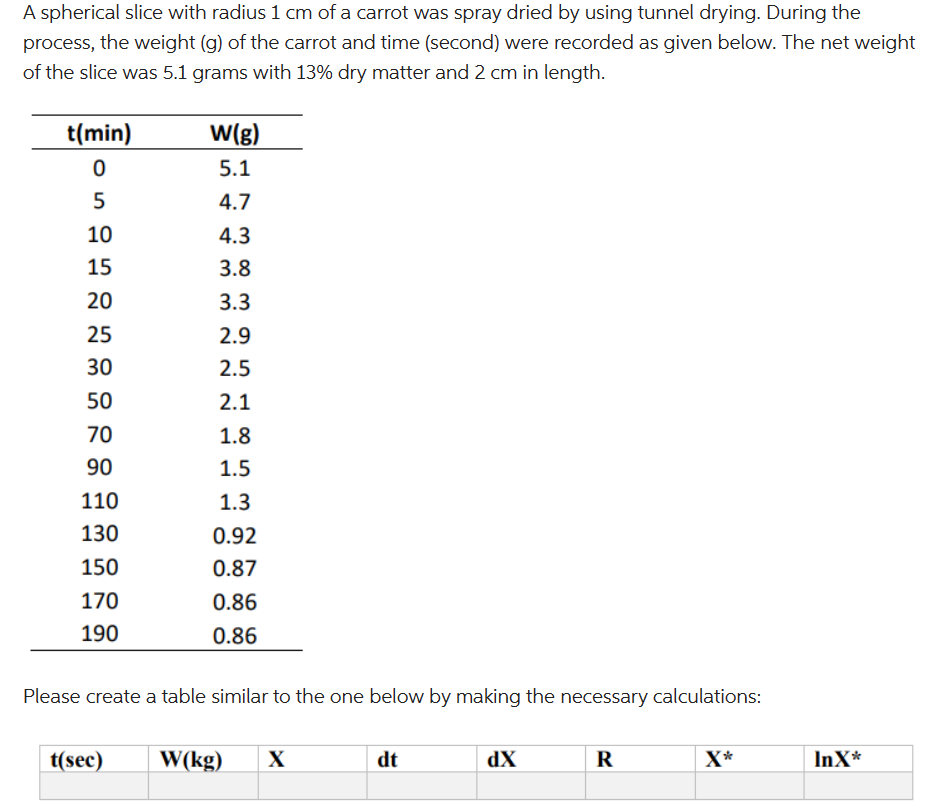
A spherical slice with radius 1cm of a carrot was spray dried by using tunnel drying. During the process, the weight (g) of the carrot and time (second) were recorded as given below. The net weight of the slice was 5.1 grams with 13% dry matter and 2cm in length. Please create a table similar to the one below by making the necessary calculations
Step by Step Solution
There are 3 Steps involved in it

Get step-by-step solutions from verified subject matter experts