

Question: Please explain and show me how to make the excel graph and explain each step to solve the question. Also dont copy and paste the
Please explain and show me how to make the excel graph and explain each step to solve the question. Also dont copy and paste the solution of a different question please.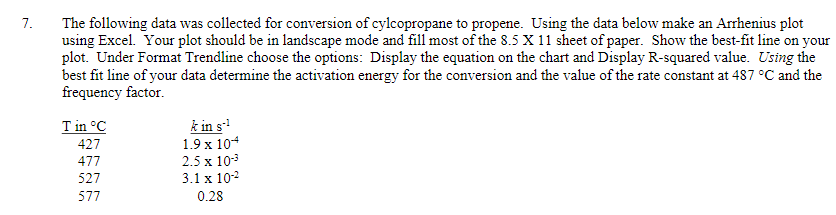
The following data was collected for conversion of cylcopropane to propene. Using the data below make an Arrhenius plot using Excel. Your plot should be in landscape mode and fill most of the 8.5X11 sheet of paper. Show the best-fit line on your plot. Under Format Trendline choose the options: Display the equation on the chart and Display R-squared value. Using the best fit line of your data determine the activation energy for the conversion and the value of the rate constant at 487C and the frequency factor
Step by Step Solution
There are 3 Steps involved in it

Get step-by-step solutions from verified subject matter experts