

Question: Please explain how three forms of EMH can be explained by this graph respectively, and why? 36 32 5 28 E 24 a2O 12 -8
Please explain how three forms of EMH can be explained by this graph respectively, and why?
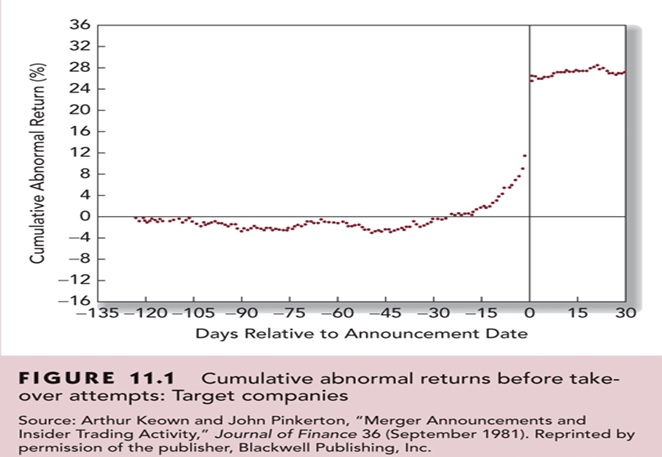
36 32 5 28 E 24 a2O 12 -8 -12 -135-120-105-90-75 604530 -15 O 15 3O Days Relative to Announcement Date FIGUURE 11.1 Cumulative abnormal returns before take- over attempts: Target companies Source: Arthur Keown and John Pinkerton, "Merger Announcements and Insider Trading Activity," Journal of Finance 36 (September 1981). Reprinted by permission of the publisher, Blackwell Publishing, Inc 2
Step by Step Solution
There are 3 Steps involved in it
1 Expert Approved Answer
Step: 1 Unlock

Question Has Been Solved by an Expert!
Get step-by-step solutions from verified subject matter experts
Step: 2 Unlock
Step: 3 Unlock