

Question: Please explain how to graph this data. 26.1-3. Boiling-Point-Diagram Calculation. The vapor-pressure data are given below for a hexane-octane system: Vapor Pressure n-Hexane n-Octane T(F)
Please explain how to graph this data.
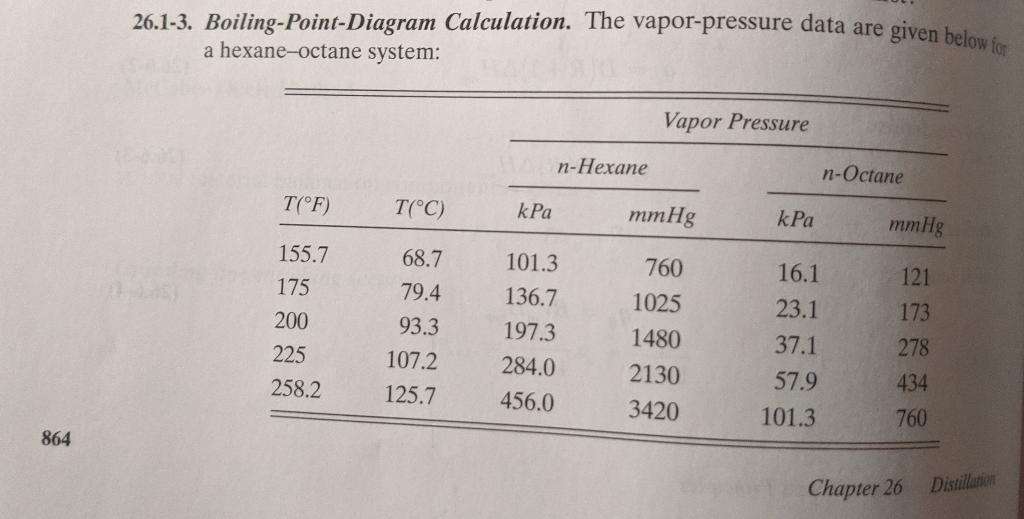
26.1-3. Boiling-Point-Diagram Calculation. The vapor-pressure data are given below for a hexane-octane system: Vapor Pressure n-Hexane n-Octane T(F) T(C) kPa mmHg kPa mmHg 760 1025 155.7 175 200 225 258.2 68.7 79.4 93.3 107.2 125.7 101.3 136.7 197.3 284.0 456.0 1480 2130 3420 16.1 23.1 37.1 57.9 101.3 121 173 278 434 760 864 Chapter 26 Distillation a) Using Raoult's law, calculate and plot the x-y data at a total pressure of 101.32 kPa. (b) Plot the boiling-point diagram. f 100 mol containing
Step by Step Solution
There are 3 Steps involved in it
1 Expert Approved Answer
Step: 1 Unlock

Question Has Been Solved by an Expert!
Get step-by-step solutions from verified subject matter experts
Step: 2 Unlock
Step: 3 Unlock