

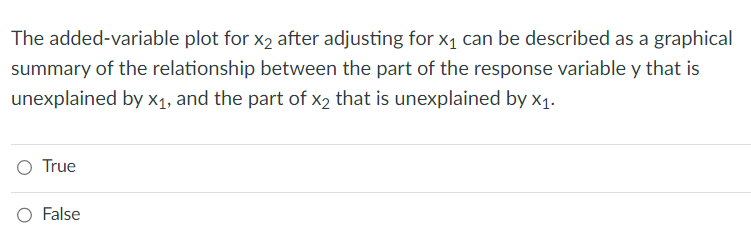
Question: please explain it The added-variable plot for x2 after adjusting for x1 can be described as a graphical summary of the relationship between the part
 please explain it
Step by Step Solution
There are 3 Steps involved in it
1 Expert Approved Answer
Step: 1 Unlock

Question Has Been Solved by an Expert!
Get step-by-step solutions from verified subject matter experts
Step: 2 Unlock
Step: 3 Unlock