

Question: please explain On the stacked bar chart below, for hydro logic region 10, approximate the Available Mean Power 1
please explain
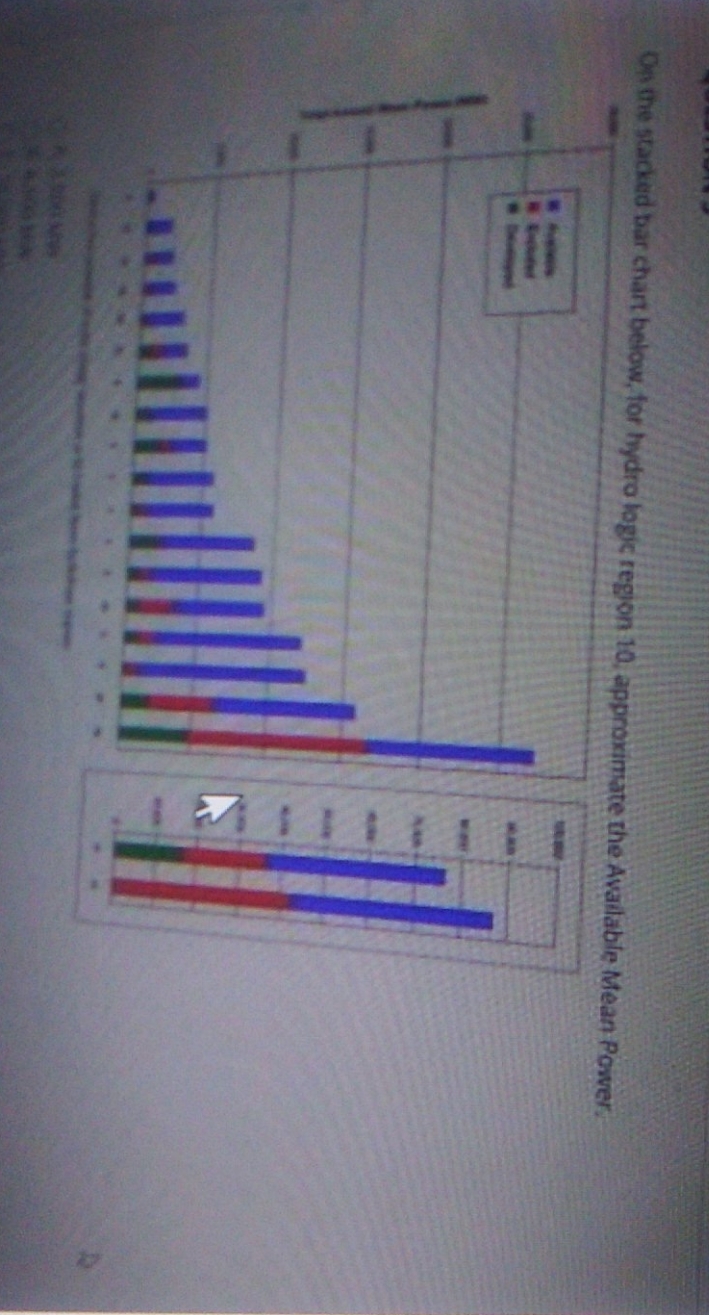
On the stacked bar chart below, for hydro logic region 10, approximate the Available Mean Power 1
Step by Step Solution
There are 3 Steps involved in it
1 Expert Approved Answer
Step: 1 Unlock

Question Has Been Solved by an Expert!
Get step-by-step solutions from verified subject matter experts
Step: 2 Unlock
Step: 3 Unlock