

Question: Please explain the answer. Thanks - X Refer to Table 56.1 - Factors for Computing Control Chart Limits (3 sigma) for this problem. Ross Hopkins
Please explain the answer.
Thanks
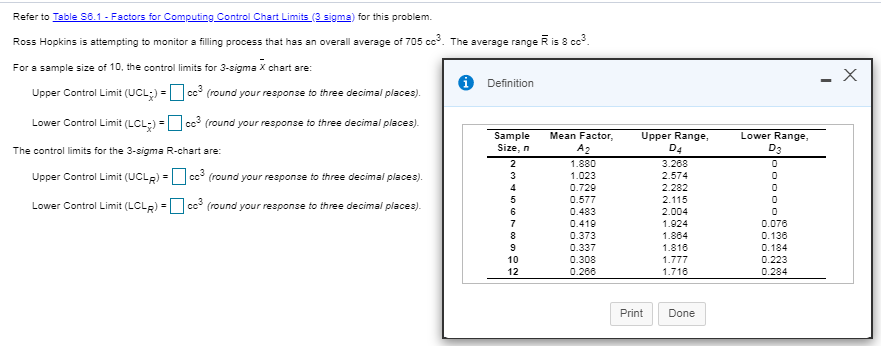
- X Refer to Table 56.1 - Factors for Computing Control Chart Limits (3 sigma) for this problem. Ross Hopkins is attempting to monitor a filling process that has an overall average of 705 ce? The average range Ris 8 ce? For a sample size of 10, the control limits for 3-sigma chart are: Definition Upper Control Limit (UCL) = cc (round your response to three decimal pieces). Lower Control Limit (LCL:)-cc round your response to three decimal places). Sample Mean Factor, The control limits for the 3-sigma R-chart are: Size, n A2 2 1.880 Upper Control Limit (UCLR) cc (round your response to three decimal places). Lower Control Limit (LCLR) - cc (round your response to three decimal places). Upper Range, D4 Lower Range D3 3 4 5 6 7 8 9 10 12 1.023 0.729 0.577 0.483 0.419 0.373 0.337 0.308 0.268 3.268 2.574 2.282 2.115 2.004 1.924 1.864 1.818 1.777 1.716 S. SOOOOOO 0.078 0.136 0.184 0.223 0.284 Print DoneStep by Step Solution
There are 3 Steps involved in it
1 Expert Approved Answer
Step: 1 Unlock

Question Has Been Solved by an Expert!
Get step-by-step solutions from verified subject matter experts
Step: 2 Unlock
Step: 3 Unlock