

Question: Please explain the output for these charts. What are the strongest and weakest correlations? And what is the r and p for each correlation? Correlations
Please explain the output for these charts. What are the strongest and weakest correlations? And what is the r and p for each correlation?
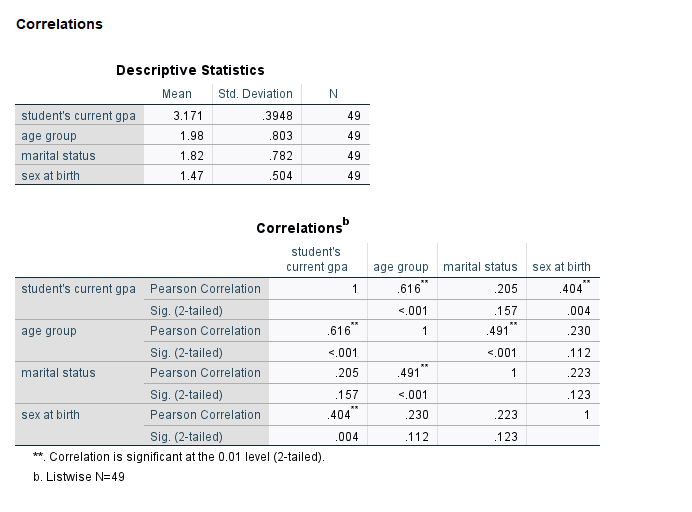
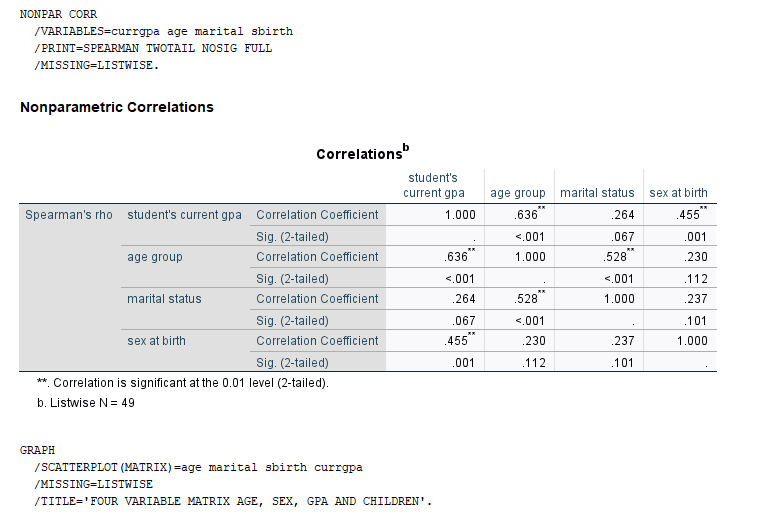
Correlations Descriptive Statistics Mean Std. Deviation N student's current gpa 3.171 3948 49 age group 1.98 803 49 marital status 1.82 782 49 sex at birth 1.47 504 49 Correlations" student's current gpa age group marital status sex at birth student's current gpa Pearson Correlation 1 616 205 404 Sig. (2-tailed) <.001 age group pearson correlation sig. marital status .123 sex at birth .404 .112 is significant the level b. listwise n="49NONPAR" corr sbirth print="SPEARMAN" twotail nosig full nonparametric correlations student current gpa spearman rho coefficient .264 .528 .067 graph currypa variable matrix and children .four>
Step by Step Solution
There are 3 Steps involved in it

Get step-by-step solutions from verified subject matter experts