

Question: please explain to me why the correct answers are correct. Researchers were investigating the association between a person's education level (high school only, college degree,
please explain to me why the correct answers are correct.
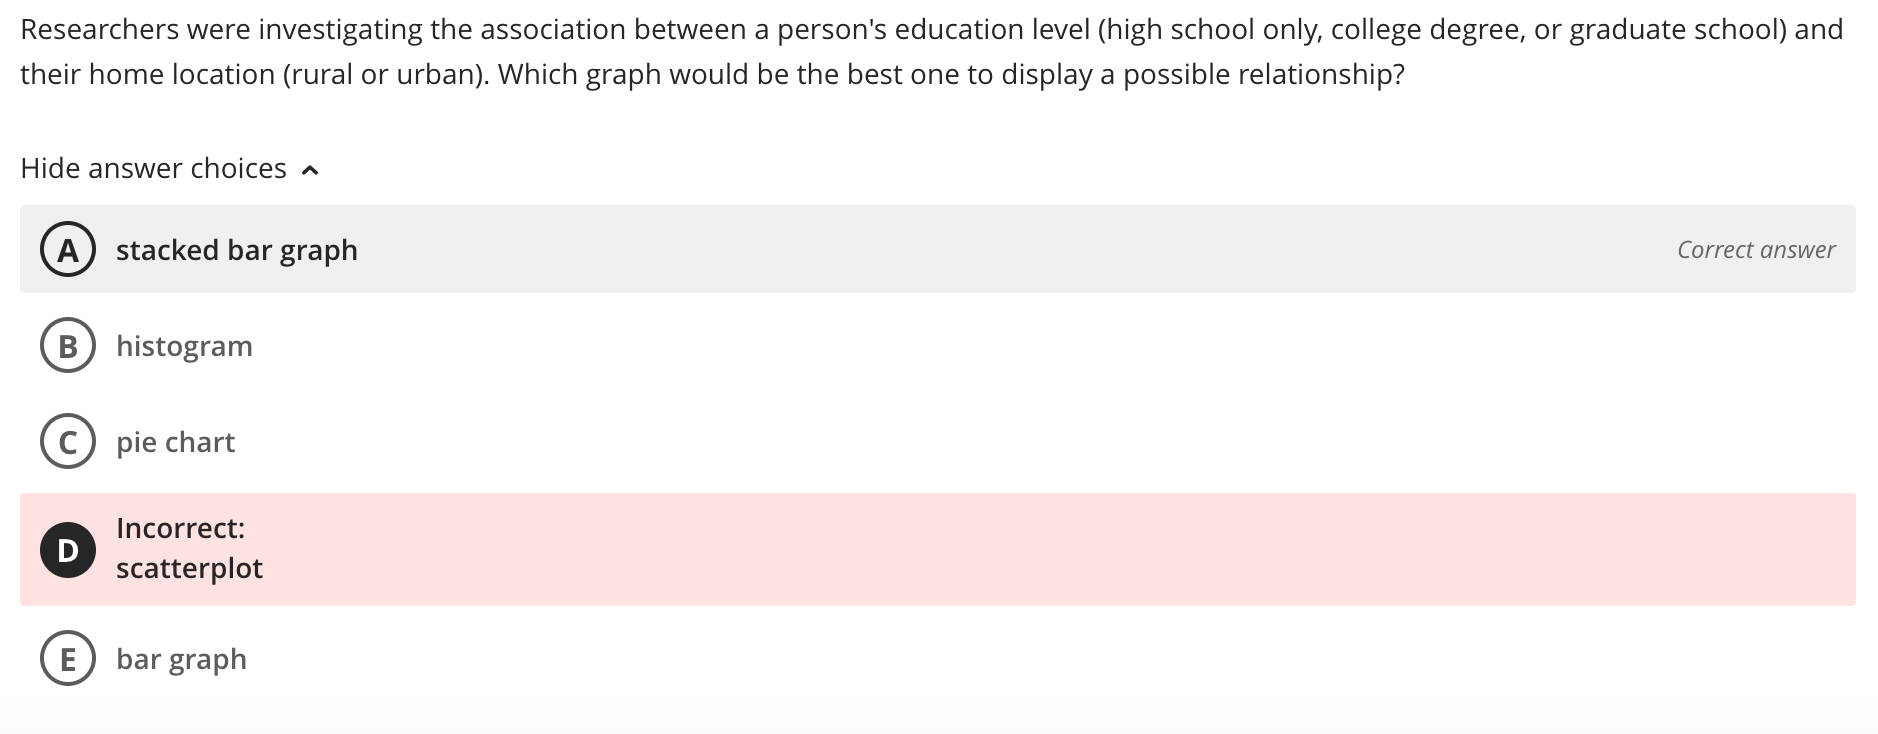
Researchers were investigating the association between a person's education level (high school only, college degree, or graduate school) and their home location (rural or urban). Which graph would be the best one to displaya possible relationship? Hide answer choices A G) stacked bar graph Correct answer 0 Incorrect: scatterplot 65) bar graph
Step by Step Solution
There are 3 Steps involved in it
1 Expert Approved Answer
Step: 1 Unlock

Question Has Been Solved by an Expert!
Get step-by-step solutions from verified subject matter experts
Step: 2 Unlock
Step: 3 Unlock