

Question: Please explain where numbers come from on excel. Sales Projections in Units January February March April |May 20,645 36,865 47,553 50,626 38,538 Projected Sales Price/Unit
Please explain where numbers come from on excel.
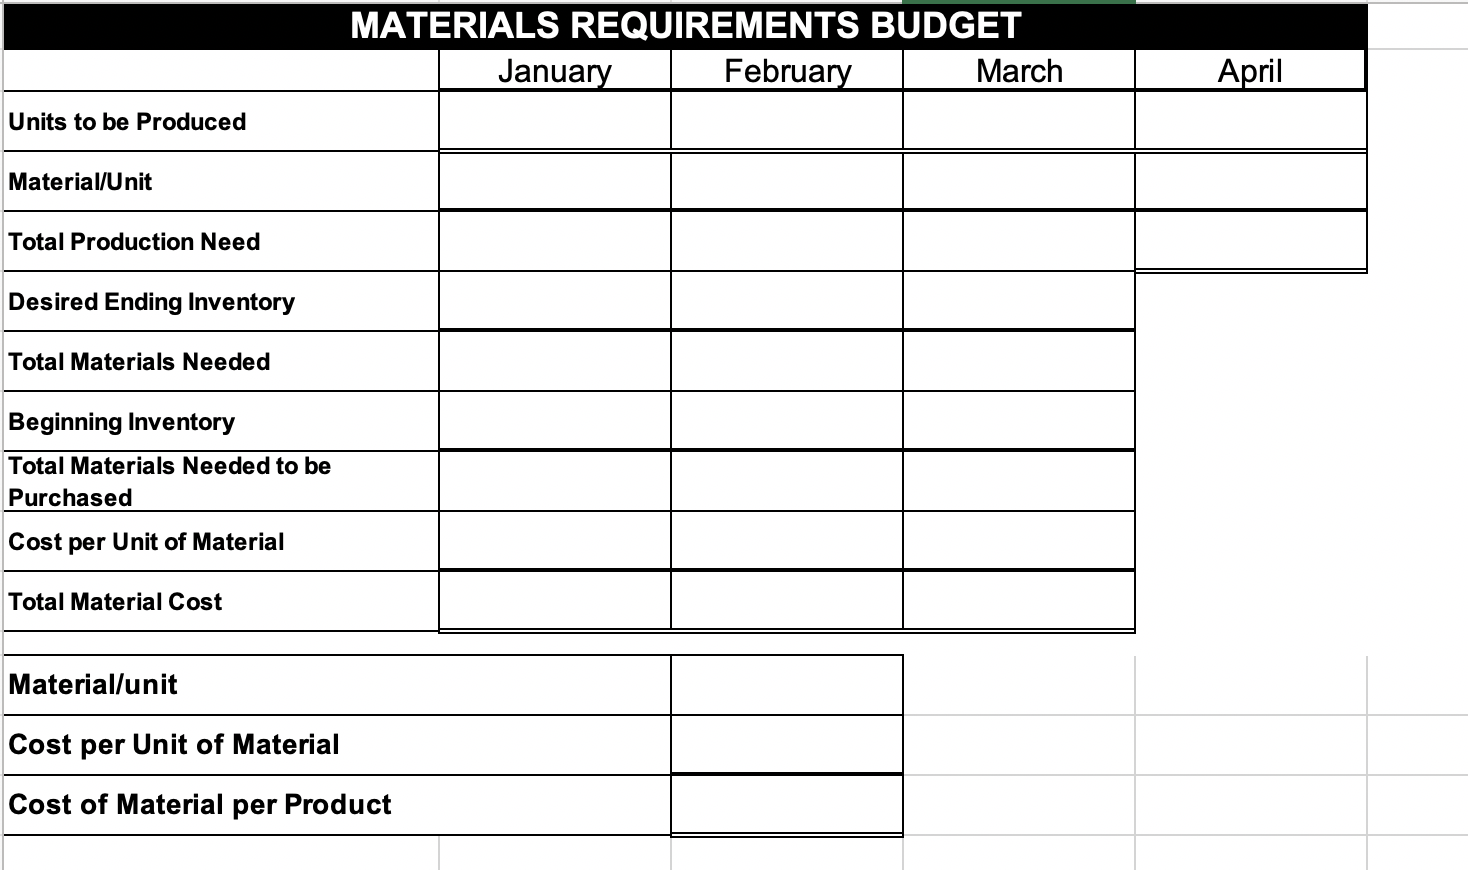
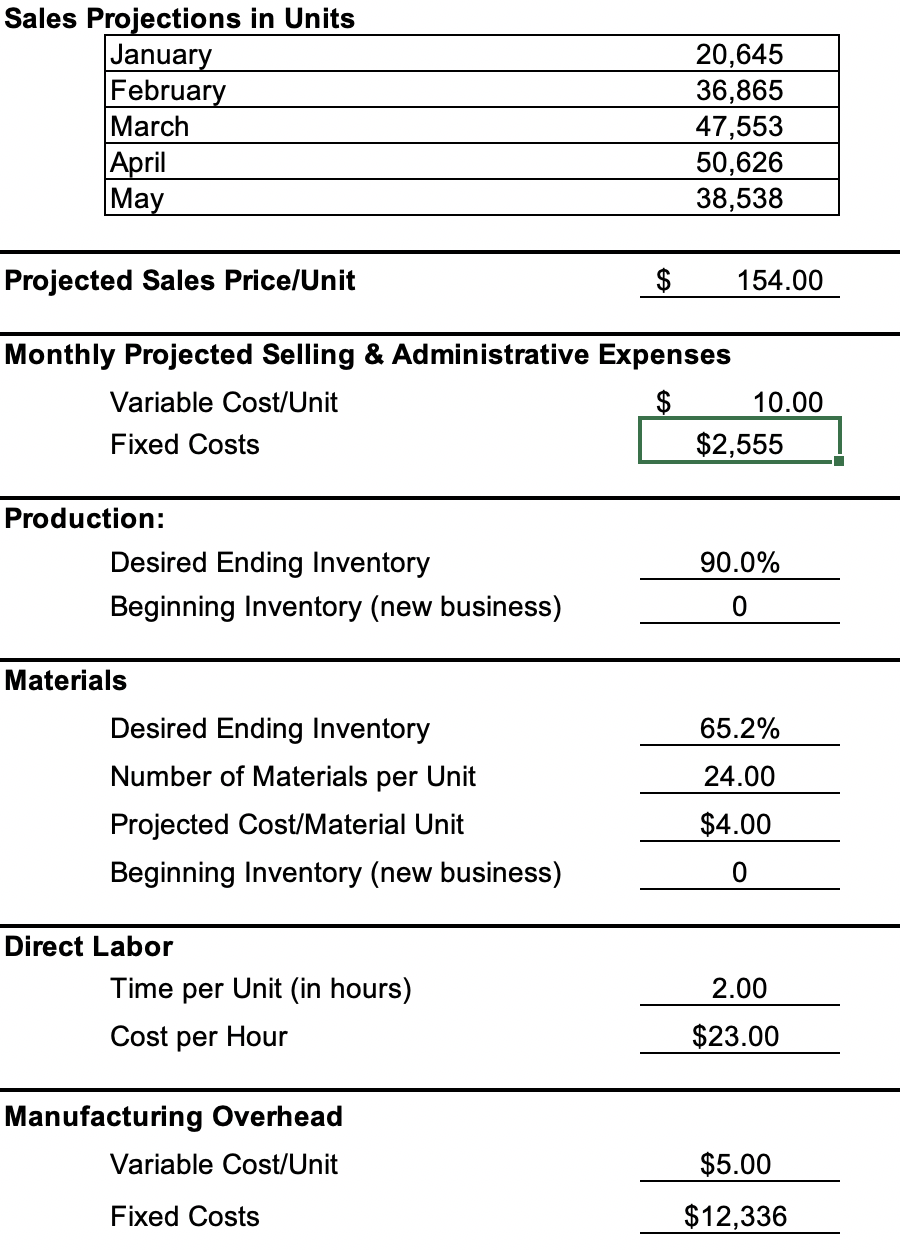
Sales Projections in Units January February March April |May 20,645 36,865 47,553 50,626 38,538 Projected Sales Price/Unit $ 154.00 Monthly Projected Selling & Administrative Expenses Variable Cost/Unit $ 10.00 Fixed Costs $2,555 Production: Desired Ending Inventory Beginning Inventory (new business) 90.0% 0 65.2% Materials Desired Ending Inventory Number of Materials per Unit Projected Cost/Material Unit Beginning Inventory business) 24.00 $4.00 0 Direct Labor Time per Unit (in hours) Cost per Hour 2.00 $23.00 Manufacturing Overhead Variable Cost/Unit $5.00 Fixed Costs $12,336 MATERIALS REQUIREMENTS BUDGET January February March April Units to be produced Material/Unit Total Production Need Desired Ending Inventory Total Materials Needed Beginning Inventory Total Materials Needed to be Purchased Cost per Unit of Material Total Material Cost Material/unit Cost per Unit of Material Cost of Material per Product
Step by Step Solution
There are 3 Steps involved in it

Get step-by-step solutions from verified subject matter experts