

Question: please fill out the chart below with information from the balance sheets provided for urban outfitters and american eagle for 2017 and 2016. (the last
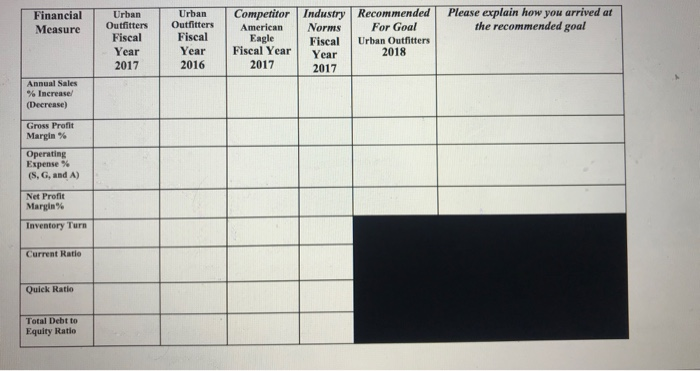
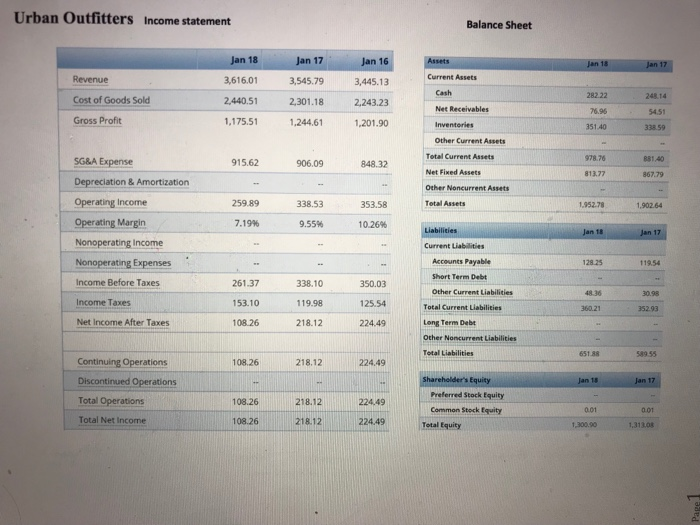
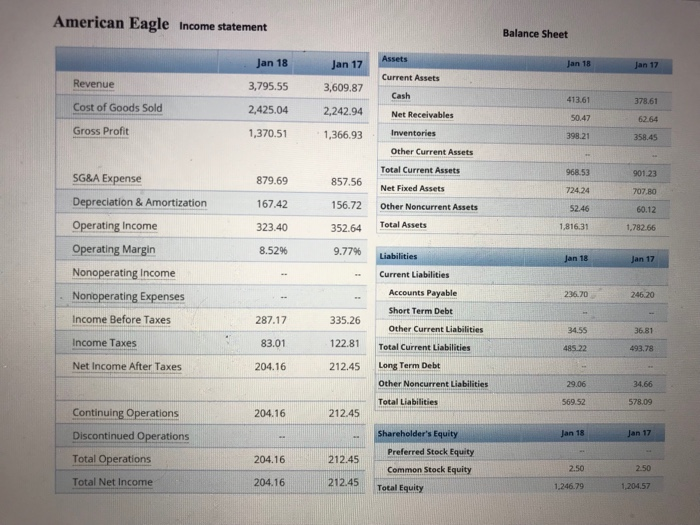
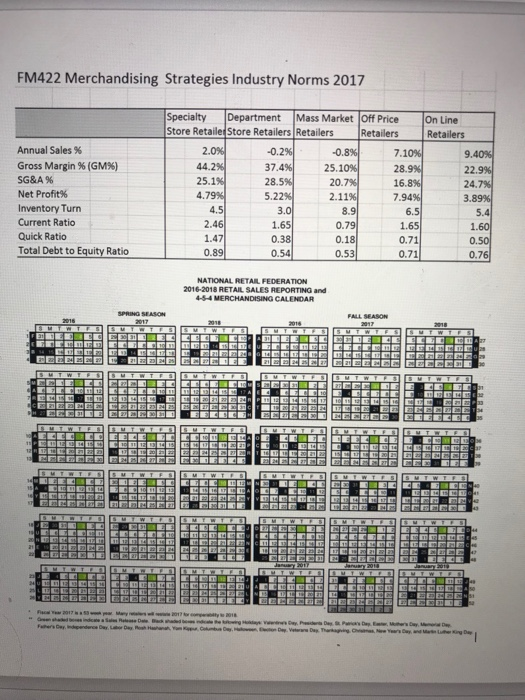
Financial T-Urban- industry! Recommended Urban- Fiscal Year Fiscal Year Year 2016 Competitor Eagle 2017 Please explain how you arrived at the recommended goal Measure Outfitters Outfitters American Norms For Goal Fiscal Year 2017 Fiscal Urban Outfitters 2018 2017 Annual Sales % Increase/ Gross Profit Margin % Operating Expense % (S, G, and A) Net Profit Margin % Inventory Turn Current Ratio Quick Ratio Total Debt to Equity Ratio Urban Outfitters Income statement Balance Sheet Jan 18Jan 17Jan 16 3,445.13 2,440.51 230.18 2,243.23 1,201.90 Jan 18Jan 17 Current Assets Revenue Cost of Goods Sold Gross Profit 3,616.01 3,545.79 248 14 Net Receivables 76.96 54.51 1,175.511,244.61 Inventories 351.40 Other Current Assets Total Current Assets Net Fixed Assets Other Noncurrent Assets Total Assets 978.76 881.40 SG&A Expense Depreciation & Amortization Operating Income Operating Margin Nonoperating income Nonoperating Expenses Income Before Taxes Income Taxes Net Income After Taxes 915.62 906.09 848.32 813.77 867.79 259.89 338.53 53.58 1952.78 1,90264 7.19% 9.55% 1 0.26% Current Liabilities Accounts Payable 128.25 119.54 Short Term Debt 261.37 53.10 108.26 338.10 19.98 218.12 350.03 125.54 224.49 Other Current Liabilities Total Current Liabilitiets Long Term Debt Other Noncurrent Liabilities Total Liabilities 30.98 360.21 352.93 651.88 58955 Continuing Operations Discontinued Operations Total Operations Total Net Income 108.26 218.12 224.49 s Equity 108.26218.122244 108.26 Preferred Stock Equity Common Steck Equity 001 0.01 21812 224.49 Total Equity 1,300.90 1,31 1308 American Eagle Income statement Balance Sheet an 18 3,795.55 2,425.04 2,242.94 Net Receivables 1,370.51 Jan 17 Jan 18 Current Assets Revenue Cost of Goods Sold Gross Profit 3,609.87 413.61 50.47 398.21 378.61 1,366.93Inventories 358.45 Other Current Assets Total Current Assets 968.53 901.23 07.80 60.12 1,782.66 SG&A Expense Depreciation & Amortization Operating Income Operating Margin Nonoperating Income Nonoperating Expenses Income Before Taxes Income Taxes Net Income After Taxes 879.69 167.42 323.40 85296 857.56 Net Fixed Assets 156.72 Other Noncurrent Assets 352.64 Total Assets 9.77% Liabilities 724.24 1,816.31 Current Liabilities Accounts Payable 236.70 246.20 Short Term Debt 287.17 83.01 204.16 335.26 other Current Liabilities 122.81 Total Current Liabilities 212.45 Long Term Debt 36.81 485.22 493.78 Other Noncurrent Liabilities 34.66 Total Liabilities 569.52 578.09 Continuing Operations Discontinued Operations Total Operations Total Net Income 204.16 212.45 .. Shareholder's Equity an 17 Preferred Stock Equity Common Stock Equity 204.16 212.45 2.50 2.50 204.16 212.45 Total Equity 1,246.79 FM422 Merchandising Strategies Industry Norms 2017 Specialty Department Mass Market Off Price On Line Store Retailer Store Retailers Retailers Gross Margin % (GM96) 1.65 Total Debt to Equity Ratio NATIONAL RETAFEDERATION Financial T-Urban- industry! Recommended Urban- Fiscal Year Fiscal Year Year 2016 Competitor Eagle 2017 Please explain how you arrived at the recommended goal Measure Outfitters Outfitters American Norms For Goal Fiscal Year 2017 Fiscal Urban Outfitters 2018 2017 Annual Sales % Increase/ Gross Profit Margin % Operating Expense % (S, G, and A) Net Profit Margin % Inventory Turn Current Ratio Quick Ratio Total Debt to Equity Ratio Urban Outfitters Income statement Balance Sheet Jan 18Jan 17Jan 16 3,445.13 2,440.51 230.18 2,243.23 1,201.90 Jan 18Jan 17 Current Assets Revenue Cost of Goods Sold Gross Profit 3,616.01 3,545.79 248 14 Net Receivables 76.96 54.51 1,175.511,244.61 Inventories 351.40 Other Current Assets Total Current Assets Net Fixed Assets Other Noncurrent Assets Total Assets 978.76 881.40 SG&A Expense Depreciation & Amortization Operating Income Operating Margin Nonoperating income Nonoperating Expenses Income Before Taxes Income Taxes Net Income After Taxes 915.62 906.09 848.32 813.77 867.79 259.89 338.53 53.58 1952.78 1,90264 7.19% 9.55% 1 0.26% Current Liabilities Accounts Payable 128.25 119.54 Short Term Debt 261.37 53.10 108.26 338.10 19.98 218.12 350.03 125.54 224.49 Other Current Liabilities Total Current Liabilitiets Long Term Debt Other Noncurrent Liabilities Total Liabilities 30.98 360.21 352.93 651.88 58955 Continuing Operations Discontinued Operations Total Operations Total Net Income 108.26 218.12 224.49 s Equity 108.26218.122244 108.26 Preferred Stock Equity Common Steck Equity 001 0.01 21812 224.49 Total Equity 1,300.90 1,31 1308 American Eagle Income statement Balance Sheet an 18 3,795.55 2,425.04 2,242.94 Net Receivables 1,370.51 Jan 17 Jan 18 Current Assets Revenue Cost of Goods Sold Gross Profit 3,609.87 413.61 50.47 398.21 378.61 1,366.93Inventories 358.45 Other Current Assets Total Current Assets 968.53 901.23 07.80 60.12 1,782.66 SG&A Expense Depreciation & Amortization Operating Income Operating Margin Nonoperating Income Nonoperating Expenses Income Before Taxes Income Taxes Net Income After Taxes 879.69 167.42 323.40 85296 857.56 Net Fixed Assets 156.72 Other Noncurrent Assets 352.64 Total Assets 9.77% Liabilities 724.24 1,816.31 Current Liabilities Accounts Payable 236.70 246.20 Short Term Debt 287.17 83.01 204.16 335.26 other Current Liabilities 122.81 Total Current Liabilities 212.45 Long Term Debt 36.81 485.22 493.78 Other Noncurrent Liabilities 34.66 Total Liabilities 569.52 578.09 Continuing Operations Discontinued Operations Total Operations Total Net Income 204.16 212.45 .. Shareholder's Equity an 17 Preferred Stock Equity Common Stock Equity 204.16 212.45 2.50 2.50 204.16 212.45 Total Equity 1,246.79 FM422 Merchandising Strategies Industry Norms 2017 Specialty Department Mass Market Off Price On Line Store Retailer Store Retailers Retailers Gross Margin % (GM96) 1.65 Total Debt to Equity Ratio NATIONAL RETAFEDERATION
Step by Step Solution
There are 3 Steps involved in it

Get step-by-step solutions from verified subject matter experts