

Question: Please find: Center line (p-bar), sample standard deviation (sigma-p-bar), Upper Control Limit and Lower Control Limit. Is the process in statistical control? Ten samples (k=10)
 Please find: Center line (p-bar), sample standard deviation (sigma-p-bar), Upper Control Limit and Lower Control Limit. Is the process in statistical control?
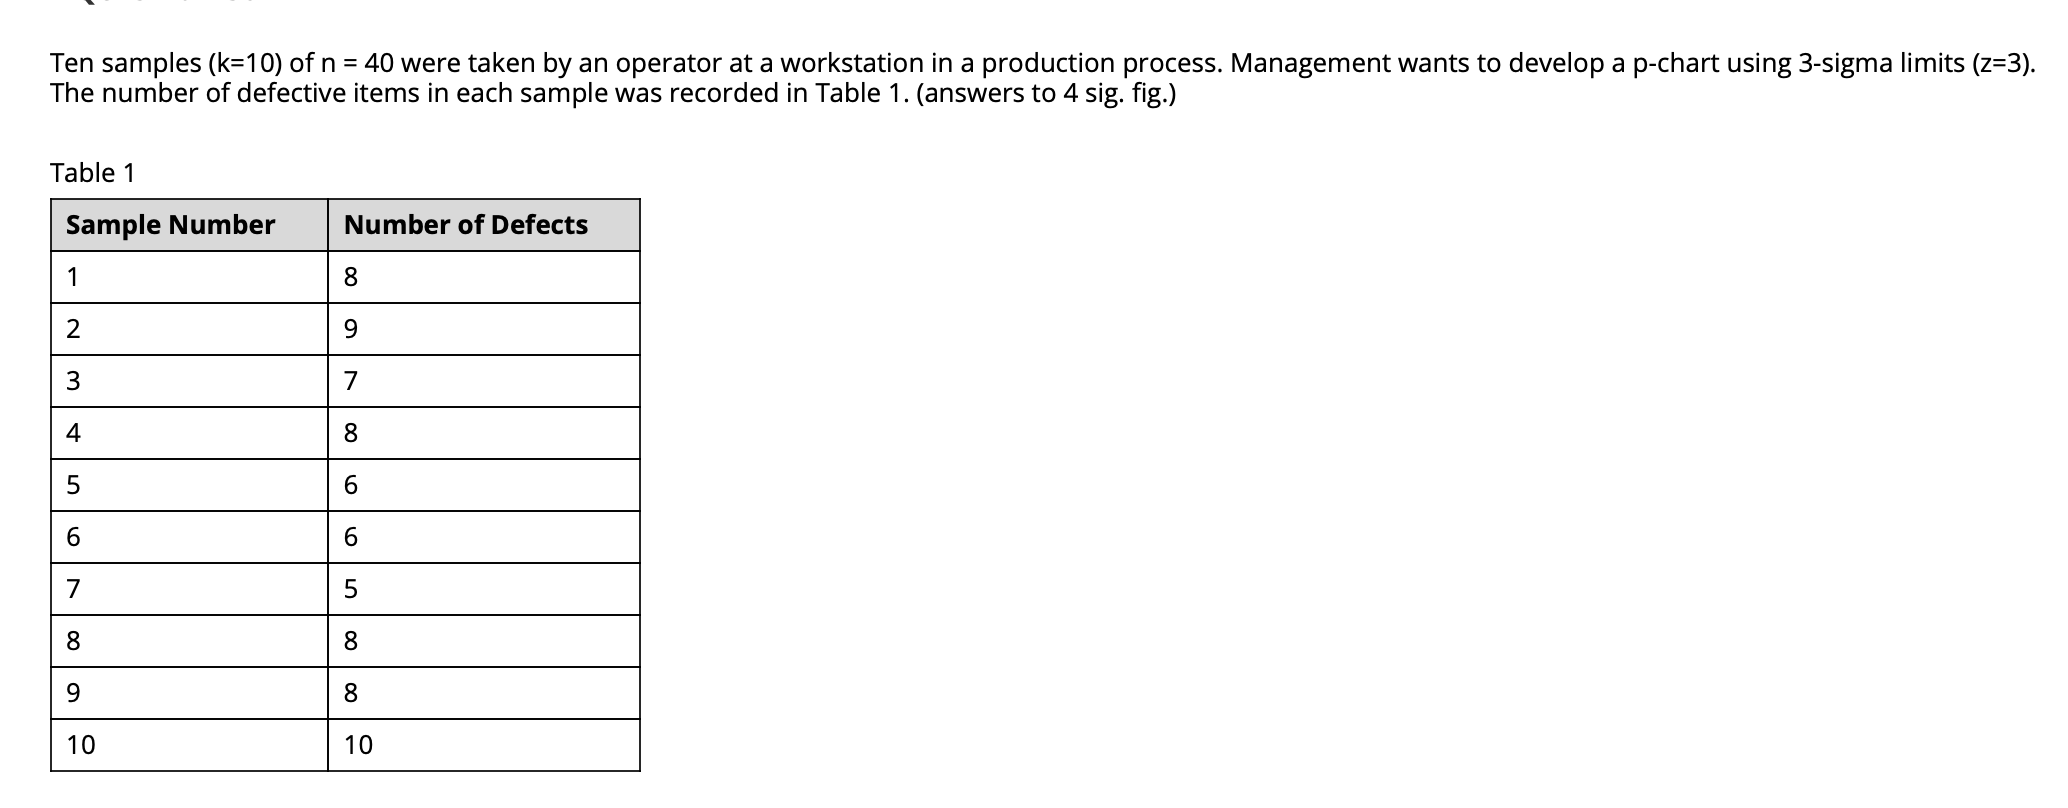
Ten samples (k=10) of n = 40 were taken by an operator at a workstation in a production process. Management wants to develop a p-chart using 3-sigma limits (z=3). The number of defective items in each sample was recorded in Table 1. (answers to 4 sig. fig.) Table 1 Sample Number Number of Defects 1 8 2 9 3 7 4 8 6 6 6 7 5 8 8 9 8 10 10
Step by Step Solution
There are 3 Steps involved in it
1 Expert Approved Answer
Step: 1 Unlock

Question Has Been Solved by an Expert!
Get step-by-step solutions from verified subject matter experts
Step: 2 Unlock
Step: 3 Unlock