

Question: please follow the instructions using python Homework Presentation & Submission: * You must attempt only the first two problems (A & B), while the others
please follow the instructions using python
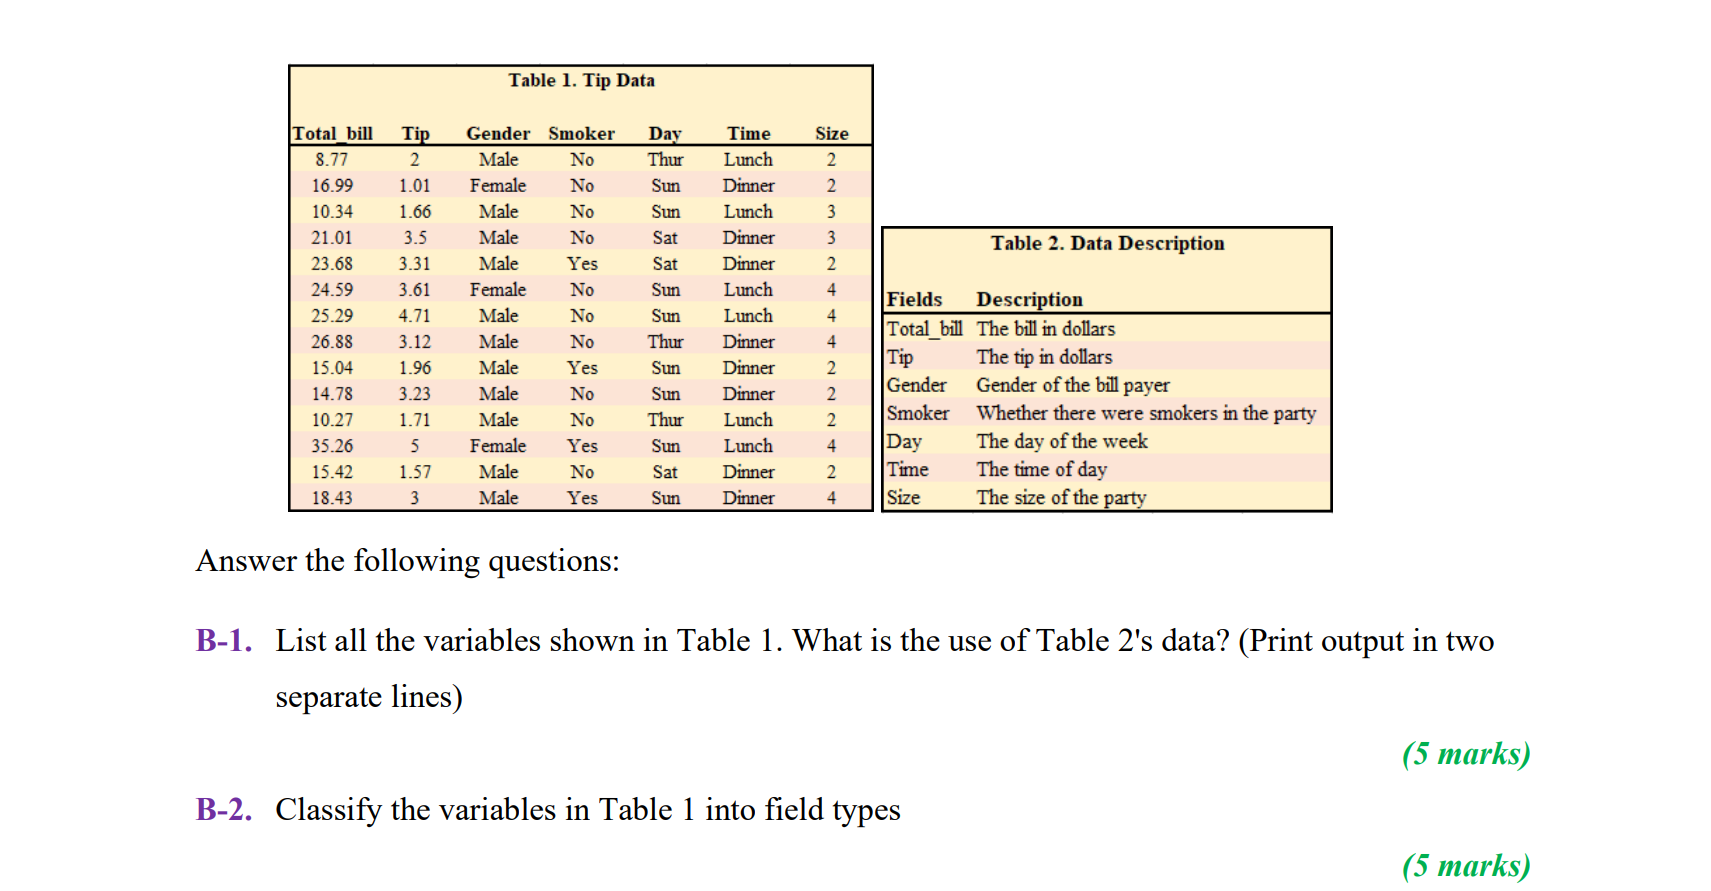
Homework Presentation \& Submission: * You must attempt only the first two problems (A \& B), while the others (C&D) are for practice purposes. * Provide the output solution for each sub-problem (part). Otherwise, 50% marks will be deducted. * Every sub-problem (part) should be answered on a DIFFERENT CELL as given in the template. * EVERY CELL should have a problem and part number clearly written in the first line. * All cells of your homework should be in CHRONOLOGICAL order. One cell per sub-problem. * Any text should be written as a comment in the code cell. Do NOT modify the code cell into the markdown cell. * Submit the entire homework as ONE single .ipynb document. * Do NOT add/delete any cell in the given template. Answer the following questions: B-1. List all the variables shown in Table 1. What is the use of Table 2's data? (Print output in two separate lines) (5 marks) B-2. Classify the variables in Table 1 into field types (5 marks) B-3. Classify the variables in Table 1 into the following terminology: Independent and dependent variables. (5 marks) B-4. Draw the histogram for Day. Name the x-axis label "Days", y-axis label "Count" and title "Histogram for Days". (5 marks) B-5. From the Day's histogram, on which day waiters gets most frequent tips? (2 marks) B-6. Draw the pie chart for Size. Print the data labels consisting of percentages (one decimal place) along with counts in parentheses. For example, 10.9\% (12). Moreover, calculate the mode of Size? (6 marks) B-7. Find the mean, median, and mode for the Tip with three decimal places. Then, crosscheck the results using manual calculations. B-8. Find the range, variance, and standard deviation for Total_bill with two decimal places. Crosscheck the results using manual calculations. (6 marks) B-9. Find the 55th and 69th percentiles (i.e., P55 and P69) for Total_bill with two decimal places. (5 marks) B-10. Draw the box plot for Total_bill. Further, set the title of the plot 'Box Plot for Total Bill'". Moreover, calculate the upper and lower whisker's values and comment on whether there are any outliers
Step by Step Solution
There are 3 Steps involved in it

Get step-by-step solutions from verified subject matter experts