

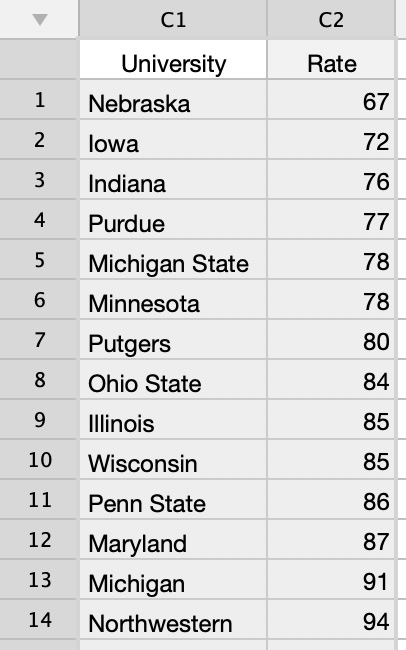
Question: Please generate a graph for the table and find out which interval of the data contains: the lowest 25% the upper 75% the middle 50%
Please generate a graph for the table and find out
which interval of the data contains:
the lowest 25%
the upper 75%
the middle 50%
the upper 50%
\f
Step by Step Solution
There are 3 Steps involved in it
1 Expert Approved Answer
Step: 1 Unlock

Question Has Been Solved by an Expert!
Get step-by-step solutions from verified subject matter experts
Step: 2 Unlock
Step: 3 Unlock