

Question: Please give a response to this discussion post Central Tendency and Variability n... l . .5 i 0. i l E. lulu l On this
Please give a response to this discussion post
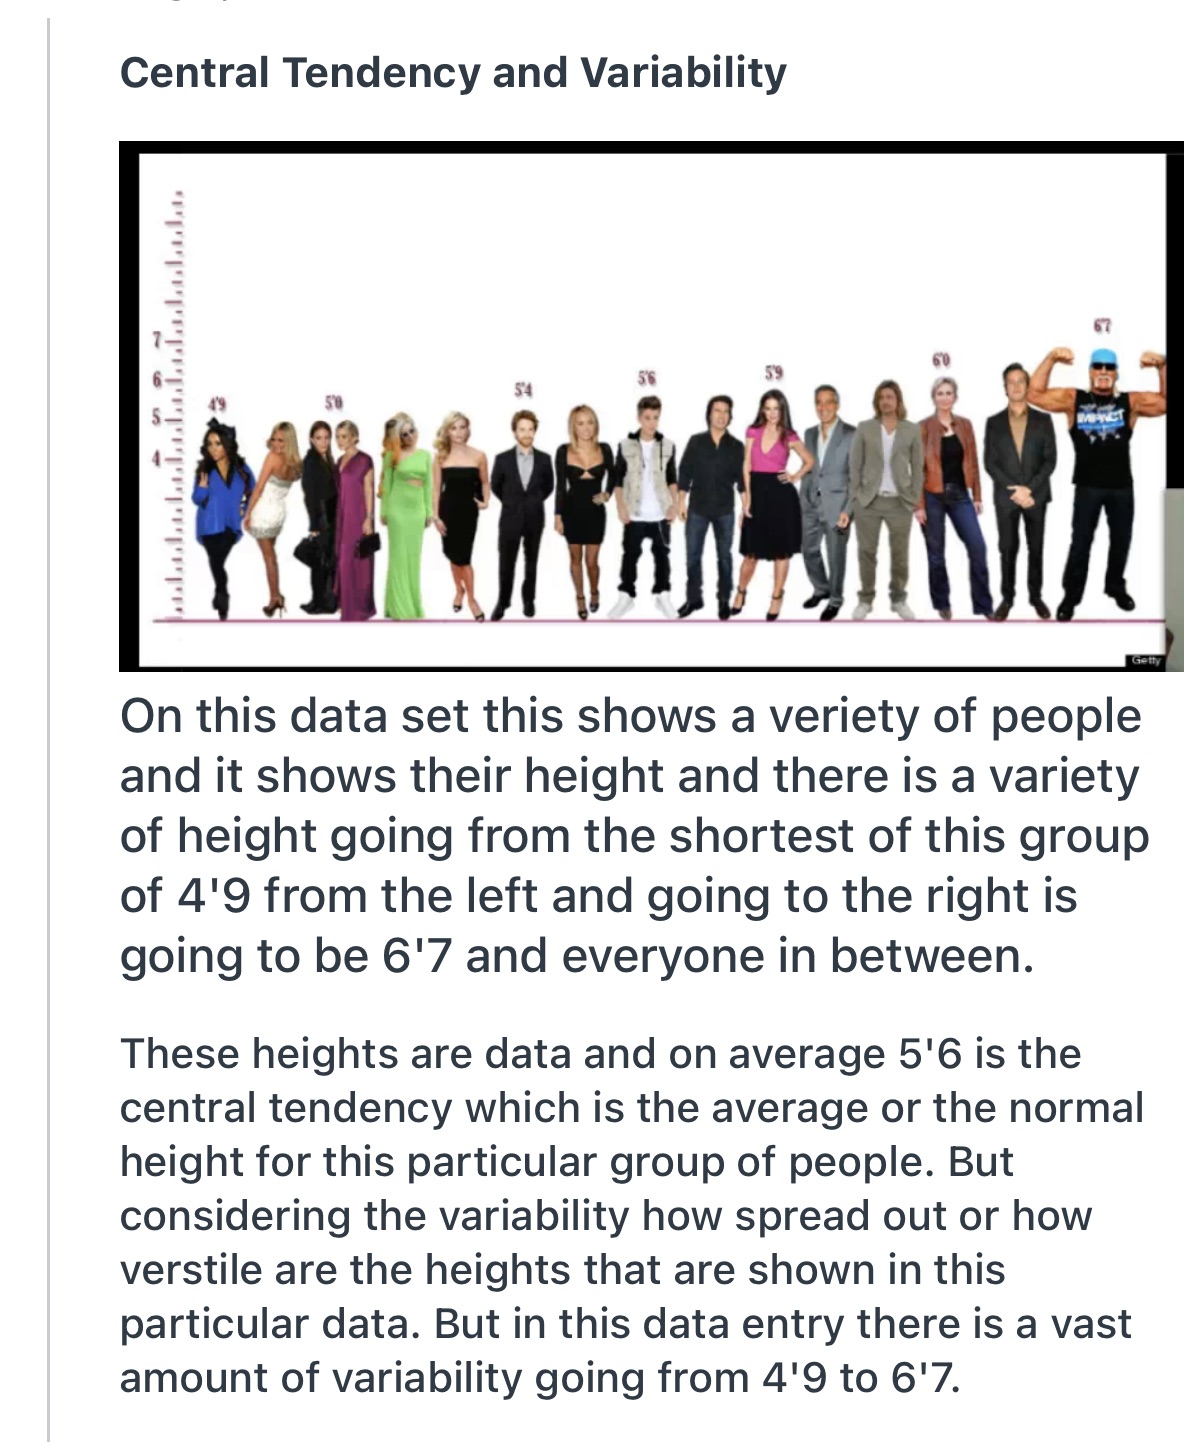
Central Tendency and Variability n... l . .5 i 0. i l E. lulu l On this data set this shows a veriety of people and it shows their height and there is a variety of height going from the shortest of this group of 4'9 from the left and going to the right is going to be 6'7 and everyone in between. .. .- - .- .. a u- n. .- :- These heights are data and on average 5'6 is the central tendency which is the average or the normal height for this particular group of people. But considering the variability how spread out or how verstile are the heights that are shown in this particular data. But in this data entry there is a vast amount of variability going from 4'9 to 6'7
Step by Step Solution
There are 3 Steps involved in it

Get step-by-step solutions from verified subject matter experts