

Question: please helo with this question 9.2.9 Question Help The data from a simple random sample with 25 observations was used to construct the plots given
please helo with this question
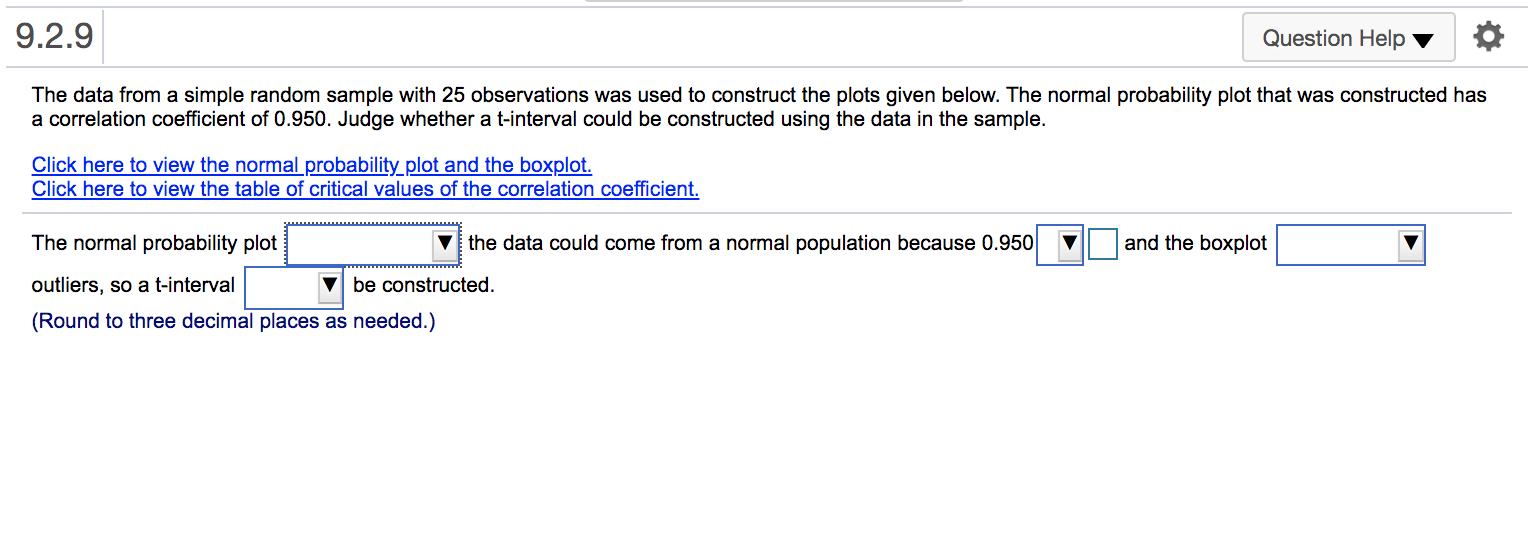
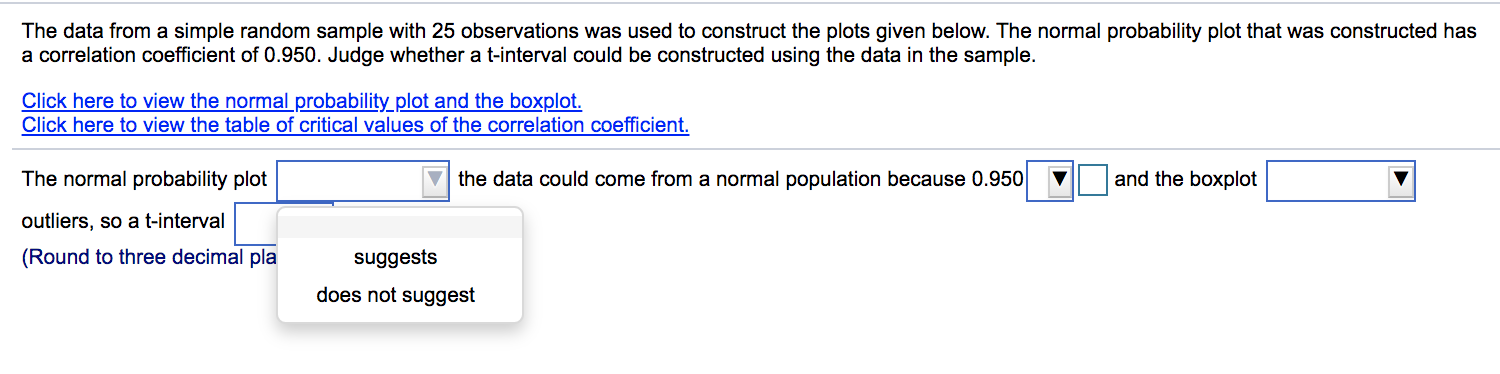
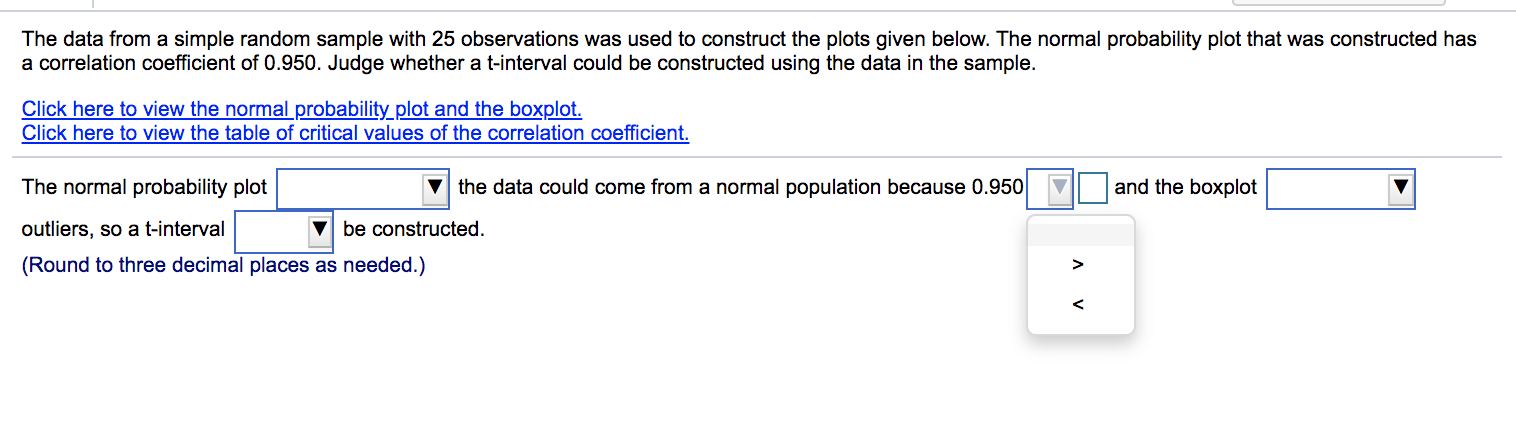
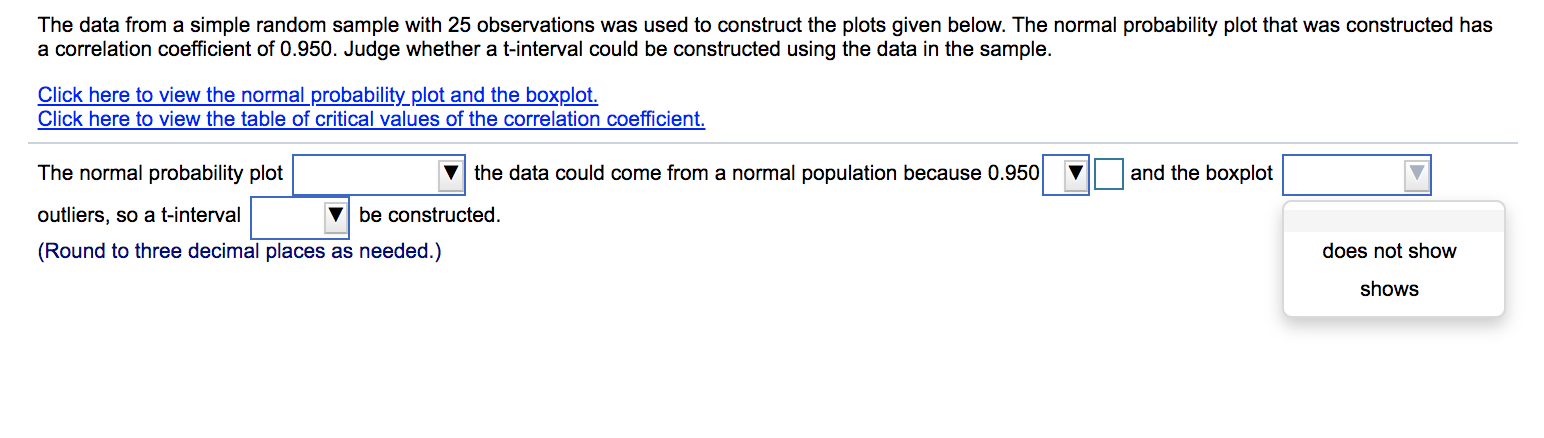
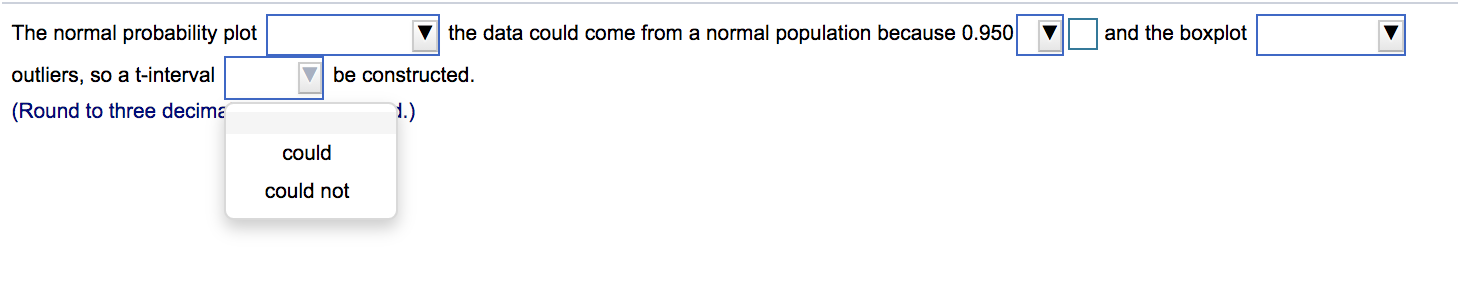
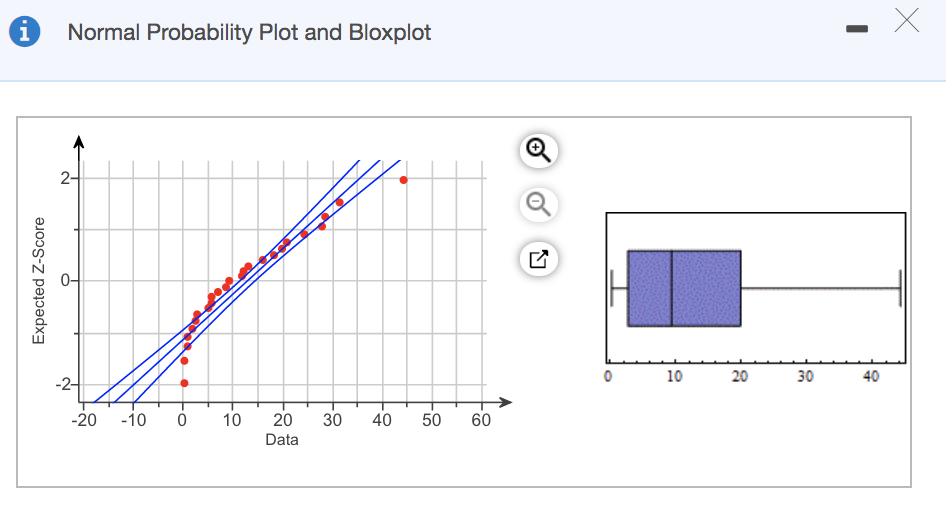
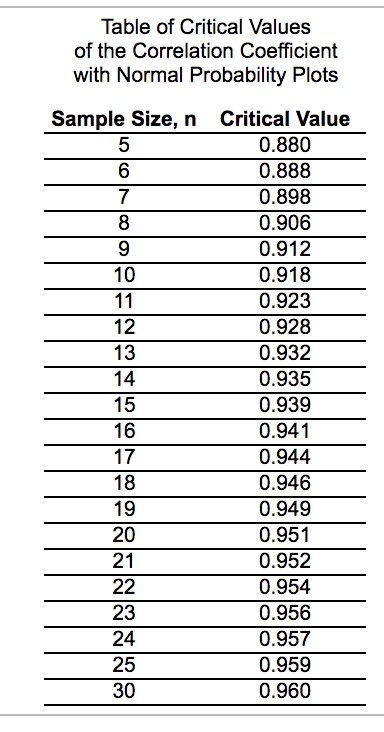
9.2.9 Question Help The data from a simple random sample with 25 observations was used to construct the plots given below. The normal probability plot that was constructed has a correlation coefficient of 0.950. Judge whether a t-interval could be constructed using the data in the sample. Click here to view the normal probability_plot and the boxplot. Click here to view the table of critical values of the correlation coefficient. The normal probability plot the data could come from a normal population because 0.950 and the boxplot outliers, so a t-interval be constructed. (Round to three decimal places as needed.)The data from a simple random sample with 25 observations was used to construct the plots given below. The normal probability plot that was constructed has a correlation coefficient of 0.950. Judge whether a t-interval could be constructed using the data in the sample. Click here to view the normal probability_plot and the boxplot. Click here to view the table of critical values of the correlation coefficient. The normal probability plot the data could come from a normal population because 0.950 and the boxplot outliers, so a t-interval (Round to three decimal pla suggests does not suggestThe data from a simple random sample with 25 observations was used to construct the plots given below. The normal probability plot that was constructed has a correlation coefficient of 0.950. Judge whether a t-interval could be constructed using the data in the sample. Click here to view the normal probability plot and the boxplot. Click here to view the table of critical values of the correlation coefficient. The normal probability plot the data could come from a normal population because 0.950 and the boxplot outliers, so a t-interval be constructed. (Round to three decimal places as needed.) >
Step by Step Solution
There are 3 Steps involved in it

Get step-by-step solutions from verified subject matter experts