

Question: The data from a simple random sample with 25 observations was used to construct the plots given below. The normal probability plot that was constructed
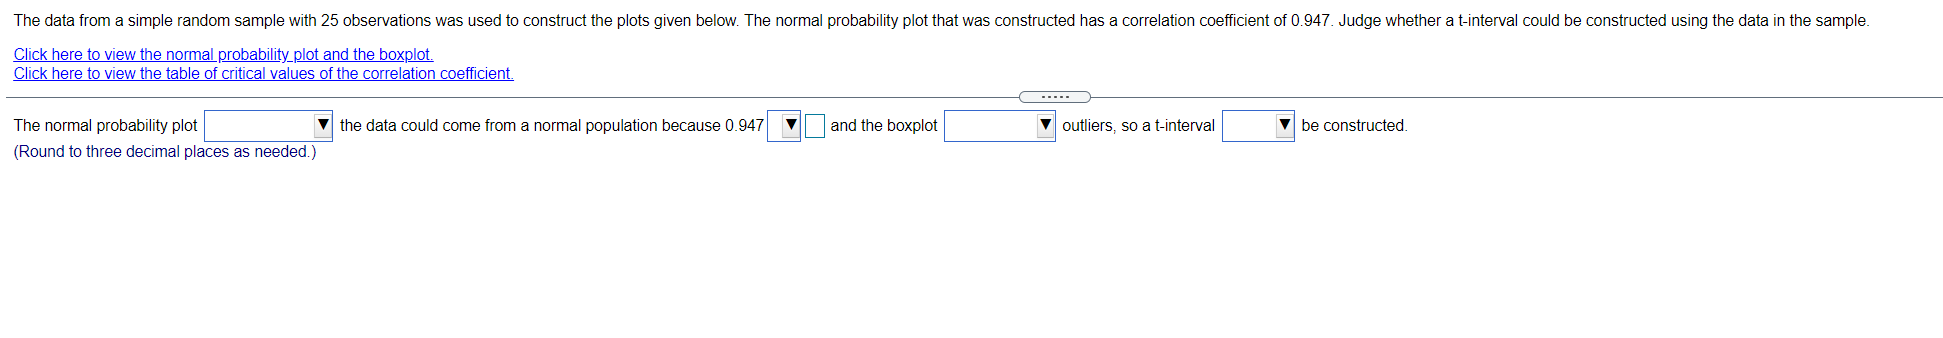
The data from a simple random sample with 25 observations was used to construct the plots given below. The normal probability plot that was constructed has a correlation coefficient of 0.947. Judge whether a t-interval could be constructed using the data in the sample. Click here to view the normal probability_plot and the boxplot. Click here to view the table of critical values of the correlation coefficient. The normal probability plot the data could come from a normal population because 0.947 | |and the boxplot outliers, so a t-interval be constructed. (Round to three decimal places as needed.)
Step by Step Solution
There are 3 Steps involved in it
1 Expert Approved Answer
Step: 1 Unlock

Question Has Been Solved by an Expert!
Get step-by-step solutions from verified subject matter experts
Step: 2 Unlock
Step: 3 Unlock