

Question: Please help and explain how you went about getting your answers AaBbCcDdEe AaBbCcDdEe AaBbCcDo AaBbCcDdEr AaBb( Aa Normal No Spacing Heading 1 Heading 2 Title
Please help and explain how you went about getting your answers
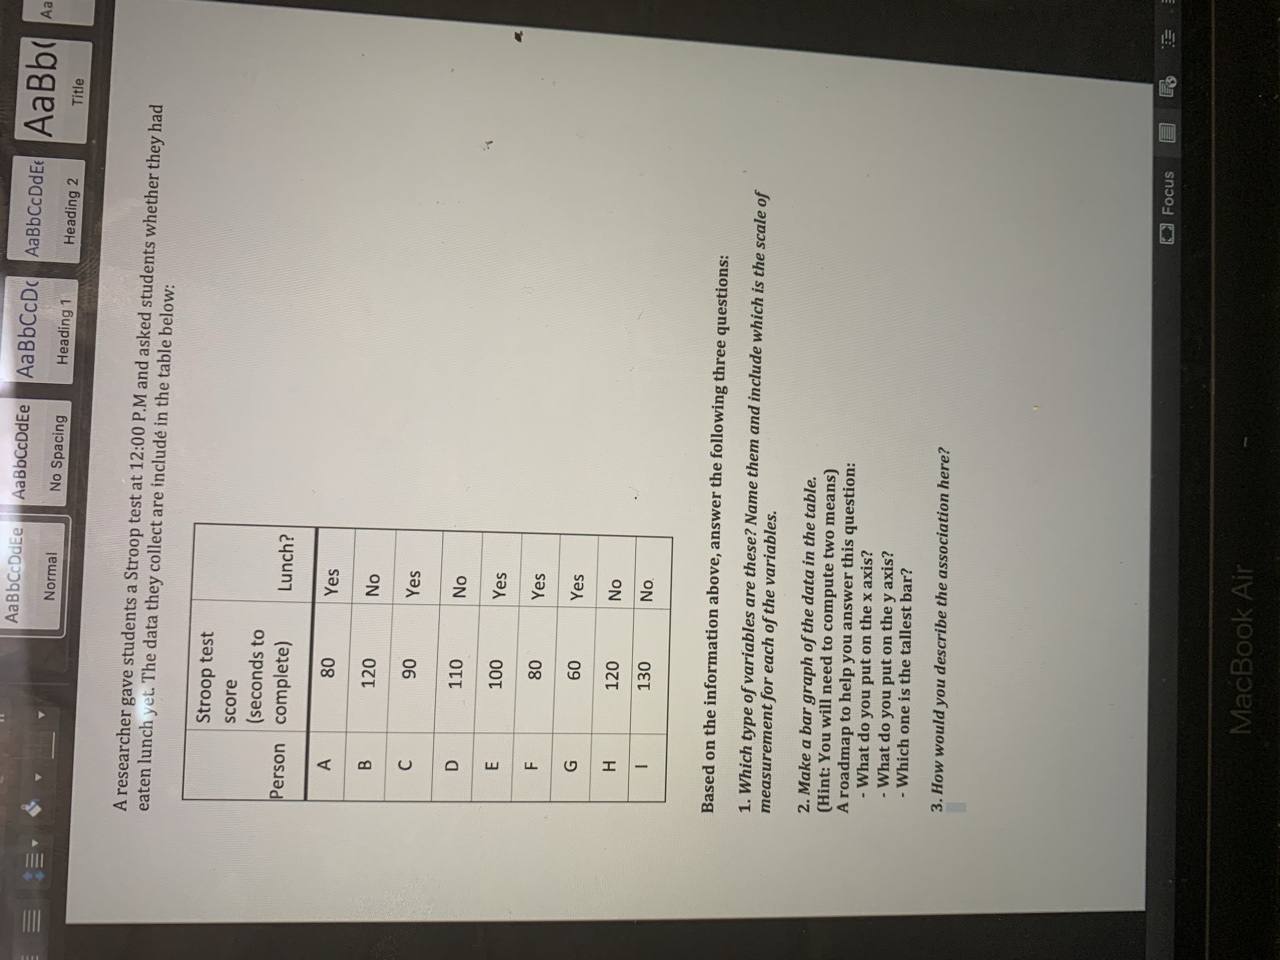
AaBbCcDdEe AaBbCcDdEe AaBbCcDo AaBbCcDdEr AaBb( Aa Normal No Spacing Heading 1 Heading 2 Title A researcher gave students a Stroop test at 12:00 P.M and asked students whether they had eaten lunch yet. The data they collect are include in the table below: Stroop test score (seconds to Person complete) Lunch? Yes CO 120 No U Yes 110 2 LU 100 Yes LL Ye Yes I 120 No 130 No Based on the information above, answer the following three questions: 1. Which type of variables are these? Name them and include which is the scale of measurement for each of the variables. 2. Make a bar graph of the data in the table. (Hint: You will need to compute two means) A roadmap to help you answer this question: - What do you put on the x axis? - What do you put on the y axis? - Which one is the tallest bar? 3. How would you describe the association here? Focus MacBook Air
Step by Step Solution
There are 3 Steps involved in it

Get step-by-step solutions from verified subject matter experts