

Question: Please help by filling out everything in the tan section. Please write down the basic formula used for each question (IE: Formula for earning per
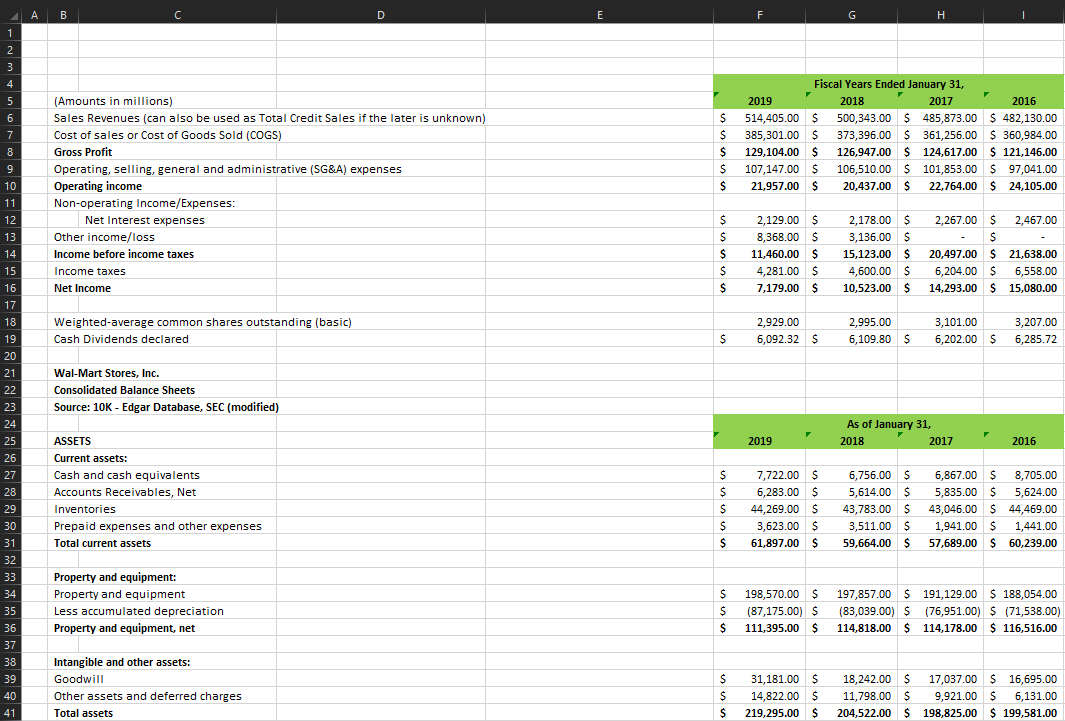
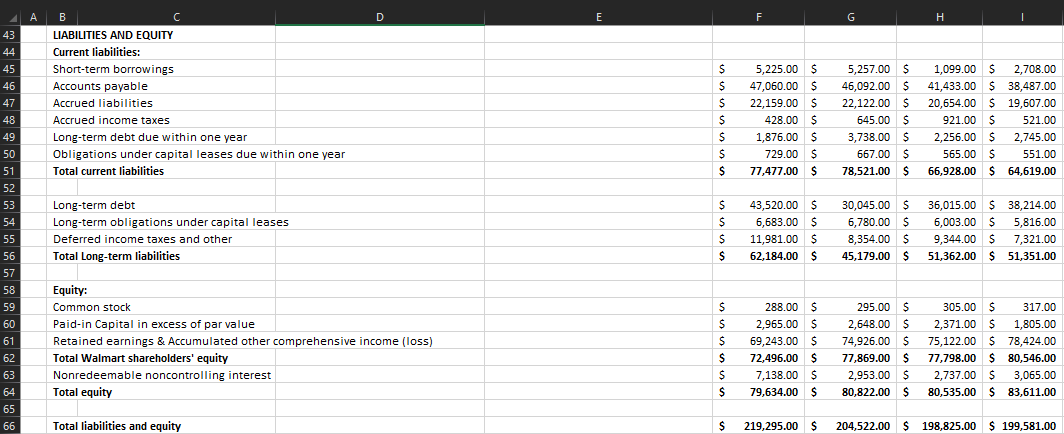

Please help by filling out everything in the tan section. Please write down the basic formula used for each question (IE: Formula for earning per share, dividends per share etc) in the formula section, then use cell reference to calculate the given question for 2019-2017. The far right column is 2017 and the 3rd column from the right is 2019 with the middle being 2018. Fourth column from the right is the formula column. Please show the answer of the calculation and what cell references that were used for the calculation for 2019. I understand you will copy the cell references and drag them across for the other years.
A B C D E F G H I 1 2 3 4. 5 6 (Amounts in millions) Sales Revenues (can also be used as Total Credit Sales if the later is unknown) Cost of sales or Cost of Goods Sold (COGS) Gross Profit Operating, selling, general and administrative (SG&A) expenses Operating income Non-operating Income/Expenses: Net Interest expenses Other income/loss Income before income taxes Income taxes Net Income Fiscal Years Ended January 31, 2019 2018 2017 2016 $ 514,405.00 $ 500,343.00 $ 485,873.00 $ 482,130.00 $ 385,301.00 $ 373,396.00 $ 361,256.00 $ 360,984.00 $ 129,104.00 $ 126,947.00 $ 124,617.00 $ 121,146.00 $ 107,147.00 $ 106,510.00 $ 101,853.00 $ 97,041.00 $ 21,957.00 $ 20,437.00 $ 22,764.00 $ 24,105.00 $ $ $ 2,129.00 $ 8,368.00 $ 11,460.00 $ 4,281.00 $ 7,179.00 $ 2,178.00 $ 3,136.00 $ 15,123.00 $ 4,600.00 $ 10,523.00 $ 2,267.00 $ 2,467.00 $ 20,497.00 $ 21,638.00 6,204.00 $ 6,558.00 14,293.00 $ 15,080.00 $ $ Weighted average common shares outstanding (basic) Cash Dividends declared 2,929.00 6,092.32 $ 2,995.00 6,109.80 $ 3,101.00 6,202.00 $ 3,207.00 6,285.72 $ 7 8 9 9 10 11 12 13 14 15 16 17 18 19 20 21 22 23 24 25 26 27 28 29 30 31 32 33 34 35 36 37 Wal-Mart Stores, Inc. Consolidated Balance Sheets Source: 10K - Edgar Database, SEC (modified) As of January 31, 2018 2017 2019 2016 ASSETS Current assets: Cash and cash equivalents Accounts Receivables, Net Inventories Prepaid expenses and other expenses Total current assets $ $ $ $ 7,722.00 $ 6,283.00 $ 44,269.00 $ 3,623.00 $ 61,897.00 $ 6,756.00 $ 5,614.00 $ 43,783.00 $ 3,511.00 $ 59,664.00 $ 6,867.00 $ 8,705.00 5,835.00 $ 5,624.00 43,046.00 $ 44,469.00 1,941.00 $ 1,441.00 57,689.00 $ 60,239.00 $ Property and equipment: Property and equipment Less accumulated depreciation Property and equipment, net $ $ $ 198,570.00 S (87,175.00) $ 111,395.00 $ 197,857.00 $ 191,129.00 $ 188,054.00 (83,039.00) $ (76,951.00) $ (71,538.00) 114,818.00 $ 114,178.00 $ 116,516.00 38 39 40 41 Intangible and other assets: Goodwill Other assets and deferred charges Total assets $ $ $ 31,181.00 $ 14,822.00 $ 219,295.00 $ 18,242.00 S 17,037.00 $ 16,695.00 11,798.00 $ 9,921.00 $ 6,131.00 204,522.00 $ 198,825.00 $ 199,581.00 A D E F H B C LIABILITIES AND EQUITY Current liabilities: Short-term borrowings Accounts payable Accrued liabilities Accrued income taxes Long-term debt due within one year Obligations under capital leases due within one year Total current liabilities $ $ $ $ $ $ $ 5,225.00 $ 47,060.00 $ 22,159.00 $ 428.00 $ 1,876.00 $ 729.00 $ 77,477.00 $ 5,257.00 $ 46,092.00 $ 22,122.00 $ 645.00 $ 3,738.00 $ 667.00 $ 78,521.00 $ 1,099.00 $ 2,708.00 41,433.00 $ 38,487.00 20,654.00 $ 19,607.00 921.00 $ 521.00 2,256.00 $ 2,745.00 565.00 $ 551.00 66,928.00 $ 64,619.00 43 44 45 46 47 48 49 50 51 52 53 54 55 56 57 58 59 60 61 62 63 64 65 66 Long-term debt Long-term obligations under capital leases Deferred income taxes and other Total Long-term liabilities $ $ $ $ 43,520.00 S 6,683.00 $ 11,981.00 $ 62,184.00 $ 30,045.00 $ 6,780.00 $ 8,354.00 $ 45,179.00 $ 36,015.00 $ 38,214.00 6,003.00 $ 5,816.00 9,344.00 $ 7,321.00 51,362.00 $ 51,351.00 $ Equity: Common stock Paid-in Capital in excess of par value Retained earnings & Accumulated other comprehensive income (loss) Total Walmart shareholders' equity Nonredeemable noncontrolling interest Total equity $ $ $ 288.00 $ 2,965.00 $ 69,243.00 $ 72,496.00 $ 7,138.00 $ 79,634.00 $ 295.00 $ 2,648.00 $ 74,926.00 $ 77,869.00 $ 2,953.00 $ 80,822.00 $ 305.00 $ 317.00 2,371.00 $ 1,805.00 75,122.00 $ 78,424.00 77,798.00 $ 80,546.00 2,737.00 $ 3,065.00 80,535.00 $ 83,611.00 $ $ Total liabilities and equity $ 219,295.00 $ 204,522.00 $ 198,825.00 $ 199,581.00 Stockholder's Revard Analysis Earnings Per Share Dividends Per Share Dividends Payout Ratio Return on Equity
Step by Step Solution
There are 3 Steps involved in it

Get step-by-step solutions from verified subject matter experts