

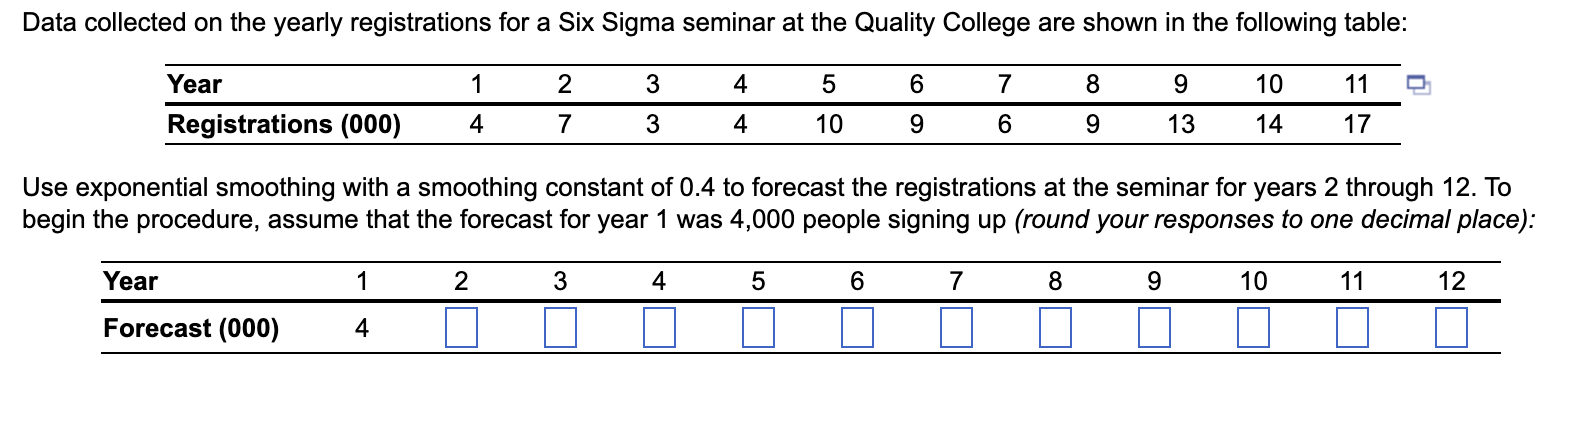
Question: PLEASE HELP!!! Data collected on the yearly registrations for a Six Sigma seminar at the Quality College are shown in the following table: Use exponential
PLEASE HELP!!! Data collected on the yearly registrations for a Six Sigma seminar at the Quality College are shown in the following table:
Use exponential smoothing with a smoothing constant of to forecast the registrations at the seminar for years through To
begin the procedure, assume that the forecast for year was people signing up round your responses to one decimal place:
Step by Step Solution
There are 3 Steps involved in it
1 Expert Approved Answer
Step: 1 Unlock

Question Has Been Solved by an Expert!
Get step-by-step solutions from verified subject matter experts
Step: 2 Unlock
Step: 3 Unlock