

Question: Please help explain chart below asap. Figure 4: The postimplementation inventory levels drop below the optimized levels that would have occurred had the group stayed
Please help explain chart below asap.
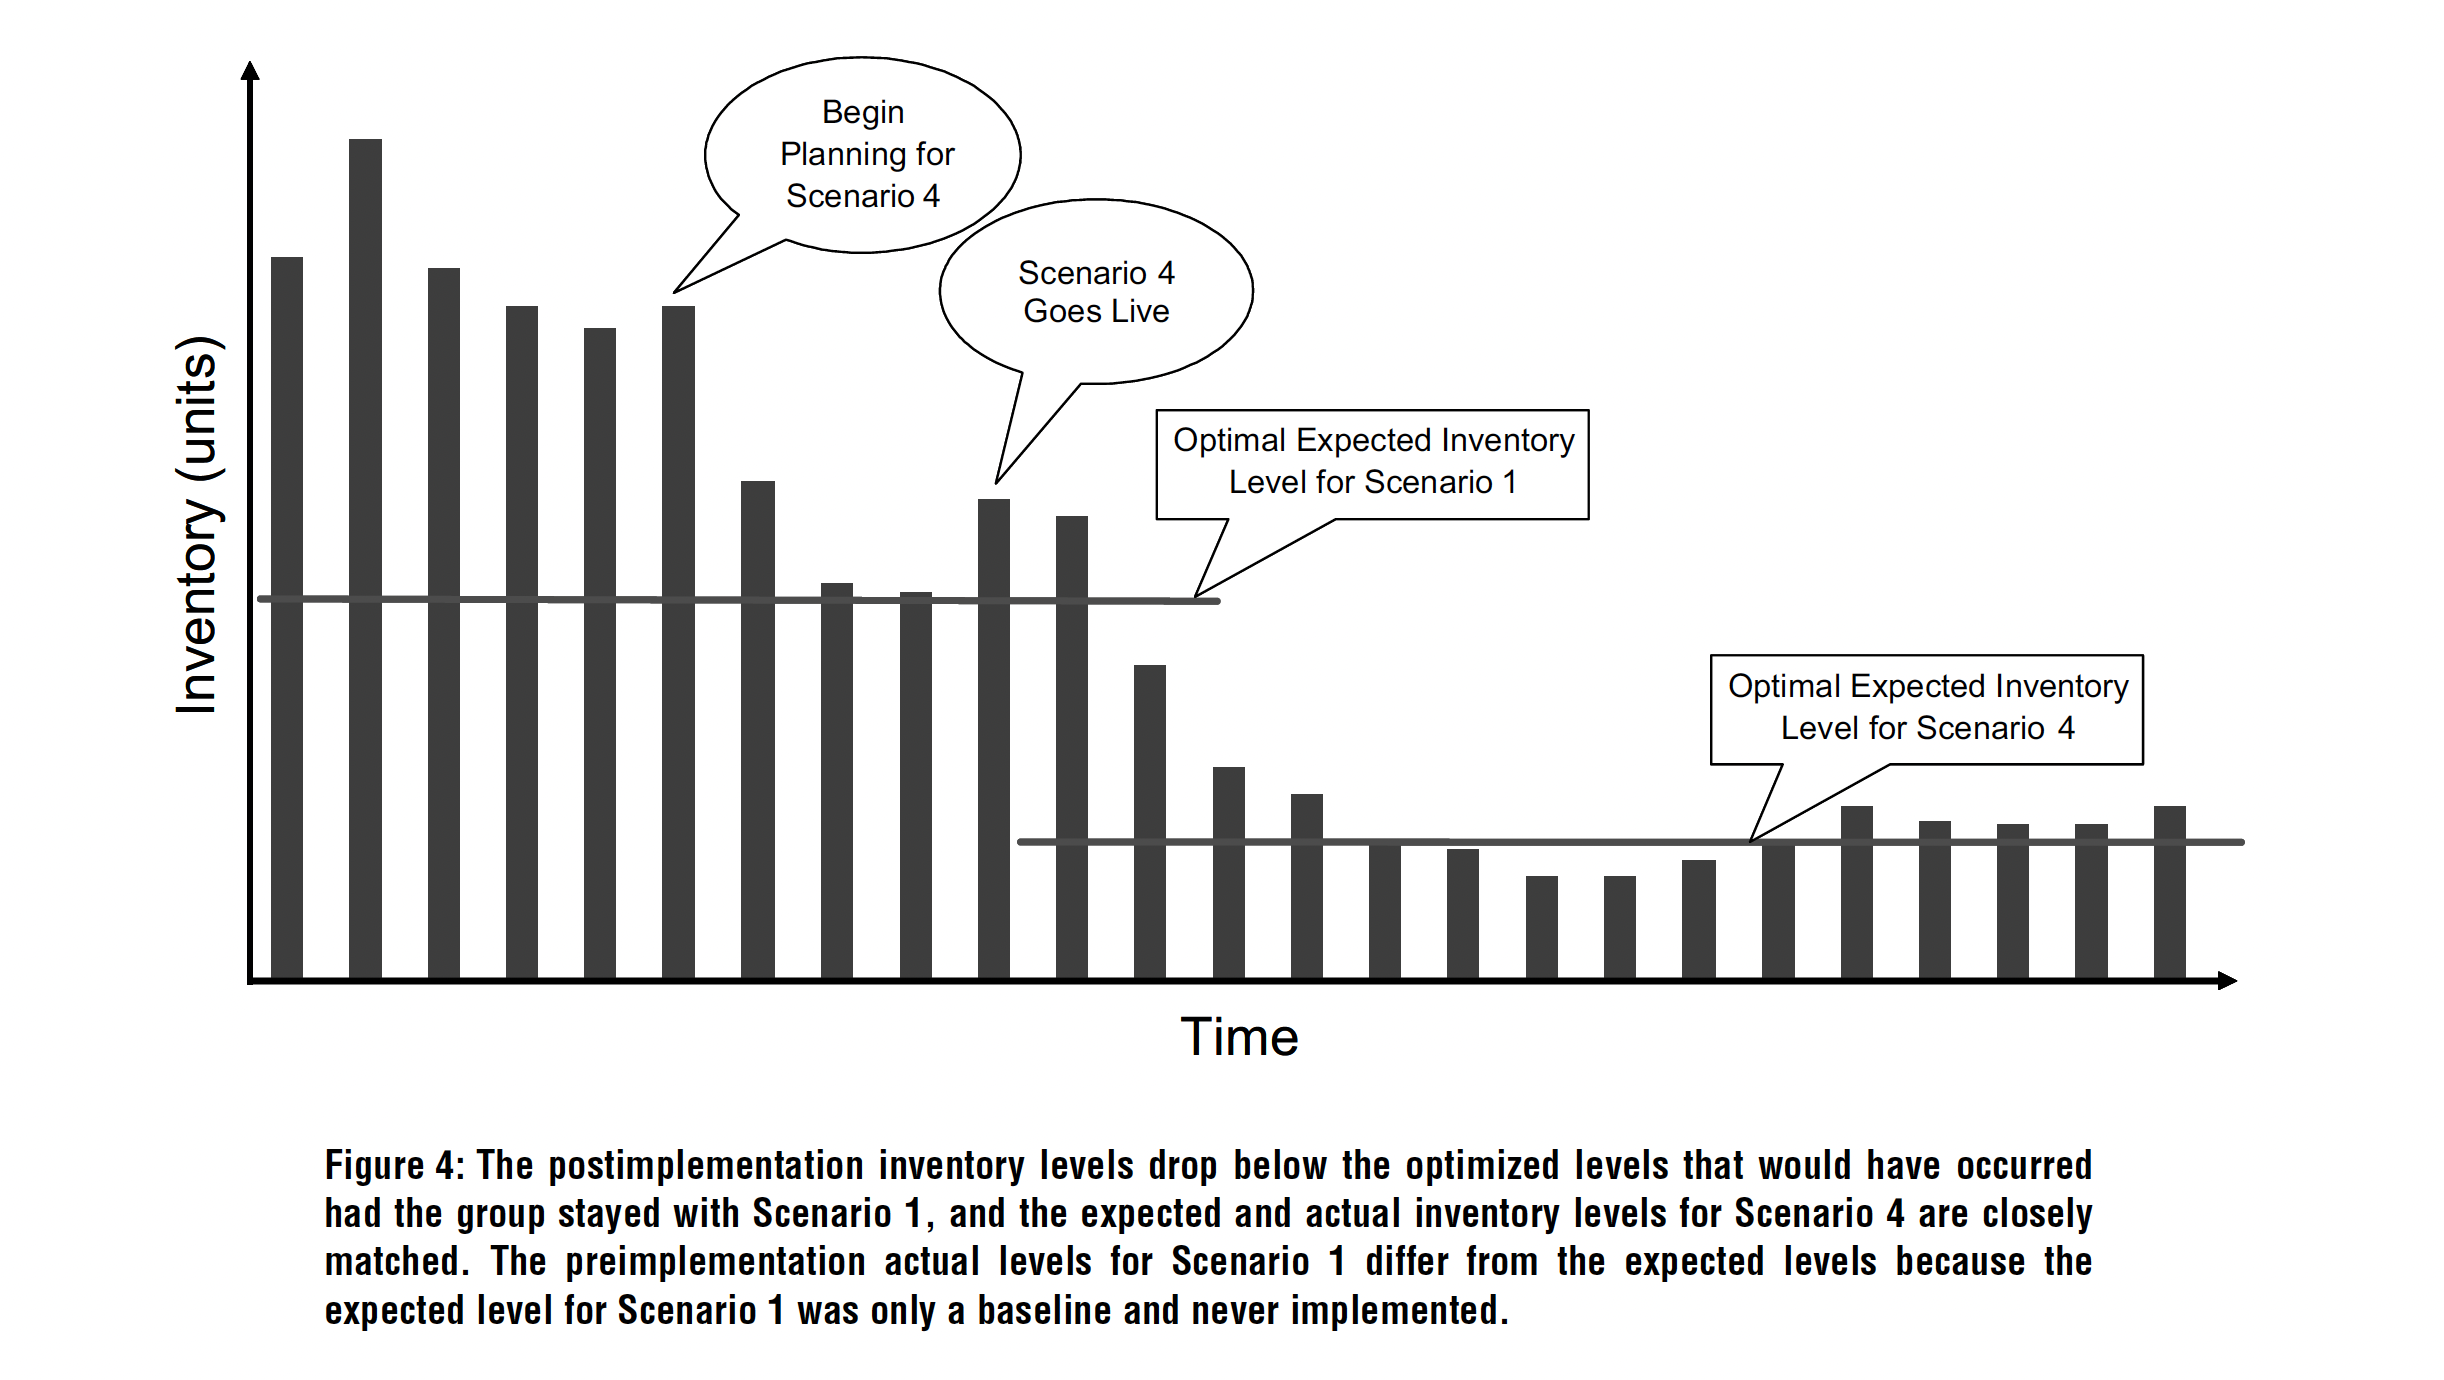
Figure 4: The postimplementation inventory levels drop below the optimized levels that would have occurred had the group stayed with Scenario 1, and the expected and actual inventory levels for Scenario 4 are closely matched. The preimplementation actual levels for Scenario 1 differ from the expected levels because the expected level for Scenario 1 was only a baseline and never implemented
Step by Step Solution
There are 3 Steps involved in it
1 Expert Approved Answer
Step: 1 Unlock

Question Has Been Solved by an Expert!
Get step-by-step solutions from verified subject matter experts
Step: 2 Unlock
Step: 3 Unlock