

Question: PLEASE HELP! Here are my graphs. I am supposed to change the colors of the lines that are listed within the graphs. The data is
PLEASE HELP!
Here are my graphs. I am supposed to change the colors of the lines that are listed within the graphs. The data is still the same but the coloring of the line graph must change
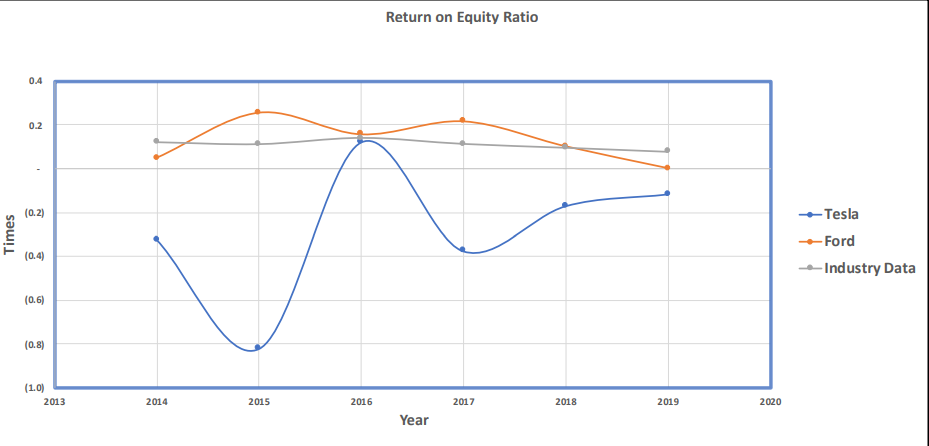
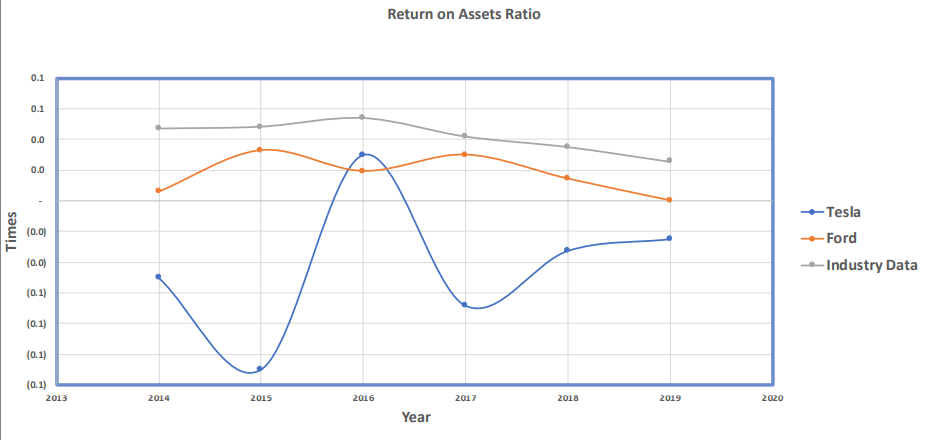
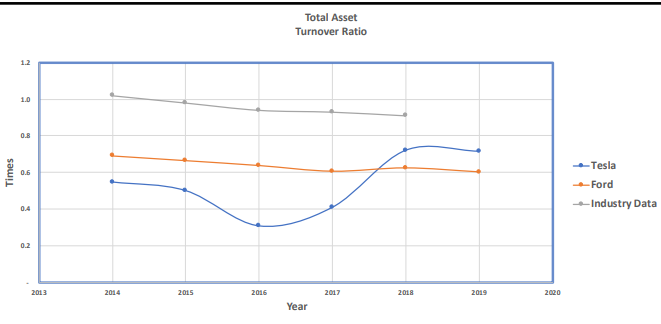
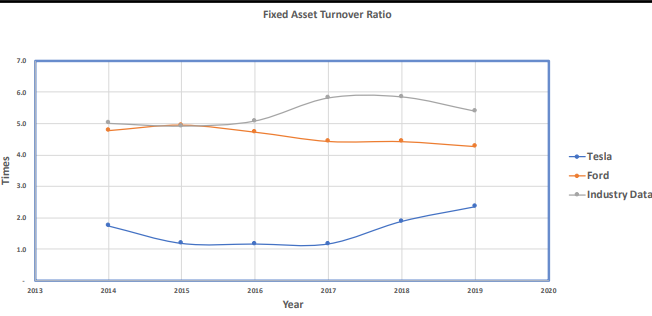
Return on Equity Ratio 0.4 0.2 (0.2) Times Tesla Ford Industry Data (0.4) (0.6) (0.8) (1.0) 2013 2014 2015 2016 2017 2018 2019 2020 Year Return on Assets Ratio 0.1 0.1 0.0 0.0 Times (0.0) Tesla -Ford -Industry Data (0.01) (0.1) (0.1) (0.1) (0.1) 2013 2014 2015 2016 2017 2018 2019 2020 Year Total Asset Turnover Ratio 1.2 1.0 0.8 Times 0.6 Tesla -Ford Industry Data 0.4 0.2 2013 2014 2015 2016 2017 2018 2019 2020 Year Fixed Asset Turnover Ratio 7.0 6.0 5.0 4.0 Times Tesla - Ford Industry Data 3.0 2.0 1.0 2013 2014 2015 2016 2017 2018 2019 2020 Year Return on Equity Ratio 0.4 0.2 (0.2) Times Tesla Ford Industry Data (0.4) (0.6) (0.8) (1.0) 2013 2014 2015 2016 2017 2018 2019 2020 Year Return on Assets Ratio 0.1 0.1 0.0 0.0 Times (0.0) Tesla -Ford -Industry Data (0.01) (0.1) (0.1) (0.1) (0.1) 2013 2014 2015 2016 2017 2018 2019 2020 Year Total Asset Turnover Ratio 1.2 1.0 0.8 Times 0.6 Tesla -Ford Industry Data 0.4 0.2 2013 2014 2015 2016 2017 2018 2019 2020 Year Fixed Asset Turnover Ratio 7.0 6.0 5.0 4.0 Times Tesla - Ford Industry Data 3.0 2.0 1.0 2013 2014 2015 2016 2017 2018 2019 2020 Year
Step by Step Solution
There are 3 Steps involved in it

Get step-by-step solutions from verified subject matter experts