

Question: Please help!! Here is my graph. I am supposed to change the color of the lines that are within each graph. The data is supposed
Please help!! Here is my graph. I am supposed to change the color of the lines that are within each graph. The data is supposed to remain the same but I must alter the color of the lines. PLEASE HELP ME
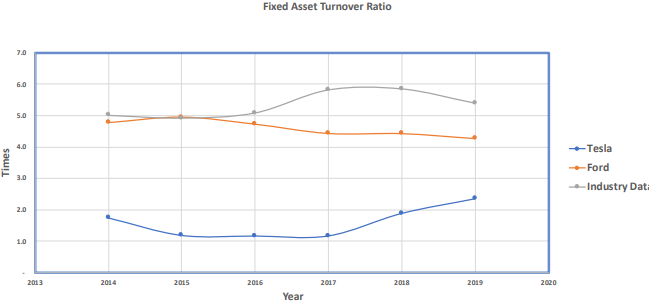
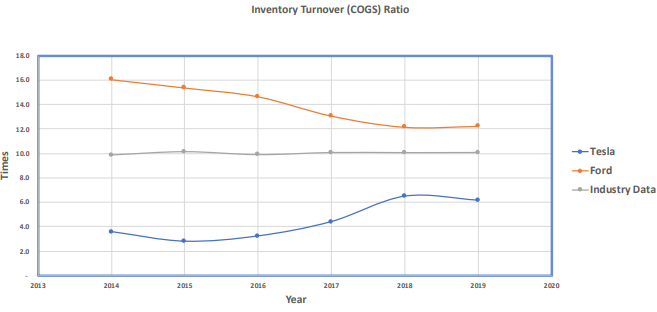
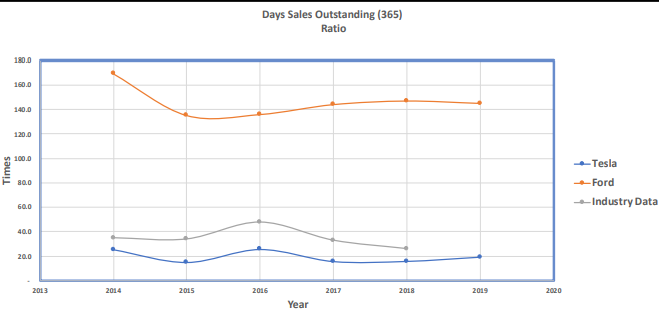
Fixed Asset Turnover Ratio 7.0 6.0 5.0 4.0 Times Tesla Ford Industry Dat: 3.0 2.0 1.0 2013 2014 2015 2016 2017 2018 2019 2020 Year Inventory Turnover (COGS) Ratio 18.0 16.0 14.0 12.0 10.0 Times Tesla +-Ford Industry Data 8.0 6.0 4.0 2.0 2013 2014 2015 2016 2017 2018 2019 2020 Year Days Sales Outstanding (365) Ratio 180.0 160.0 140.0 120.0 100.0 Times 80.0 Tesla Ford -Industry Data 60.0 40.0 20.0 2013 2014 2015 2016 2017 2018 2019 2020 Year Fixed Asset Turnover Ratio 7.0 6.0 5.0 4.0 Times Tesla Ford Industry Dat: 3.0 2.0 1.0 2013 2014 2015 2016 2017 2018 2019 2020 Year Inventory Turnover (COGS) Ratio 18.0 16.0 14.0 12.0 10.0 Times Tesla +-Ford Industry Data 8.0 6.0 4.0 2.0 2013 2014 2015 2016 2017 2018 2019 2020 Year Days Sales Outstanding (365) Ratio 180.0 160.0 140.0 120.0 100.0 Times 80.0 Tesla Ford -Industry Data 60.0 40.0 20.0 2013 2014 2015 2016 2017 2018 2019 2020 Year
Step by Step Solution
There are 3 Steps involved in it

Get step-by-step solutions from verified subject matter experts