

Question: Please help. I attatched the directions for thr assignment and each of the data sets P1-P4. Instructions: Simple &. Multiple Regression Homework - Gownload the
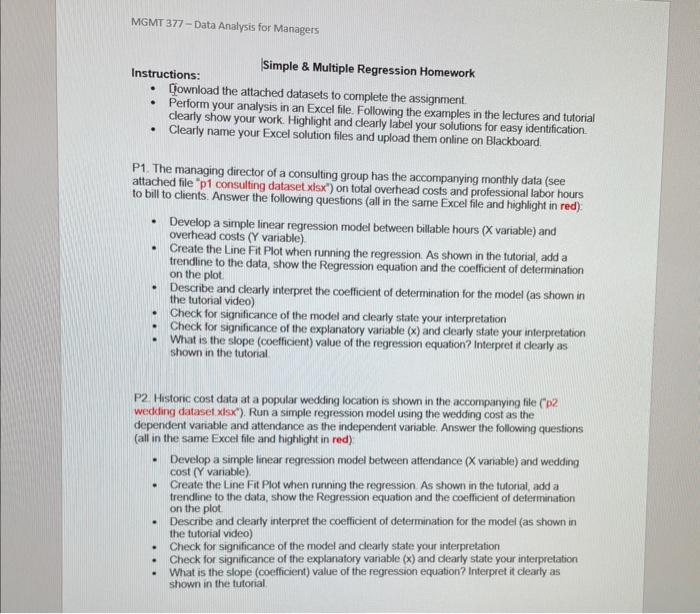
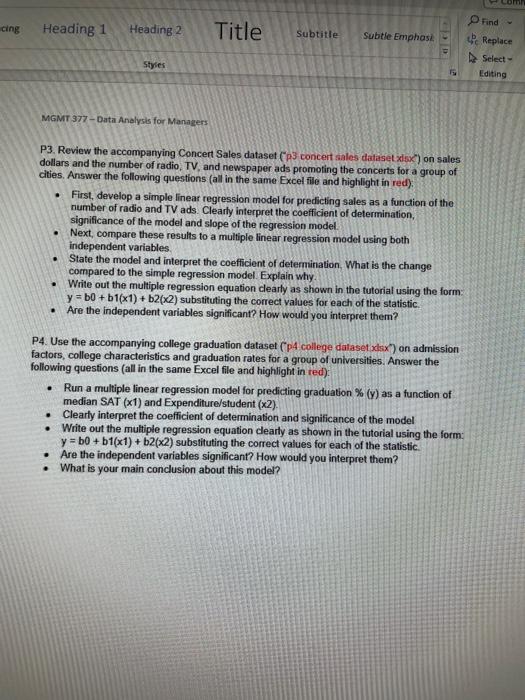
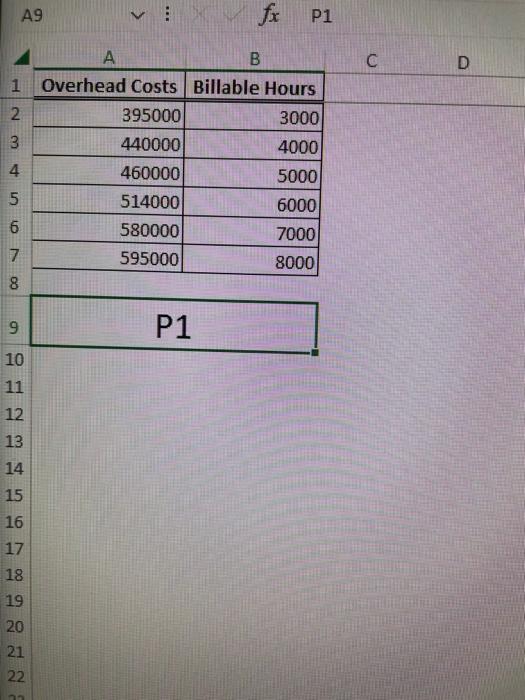
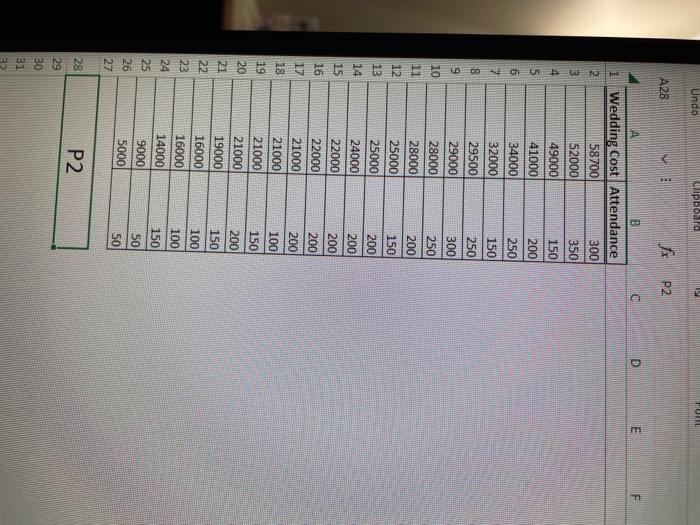
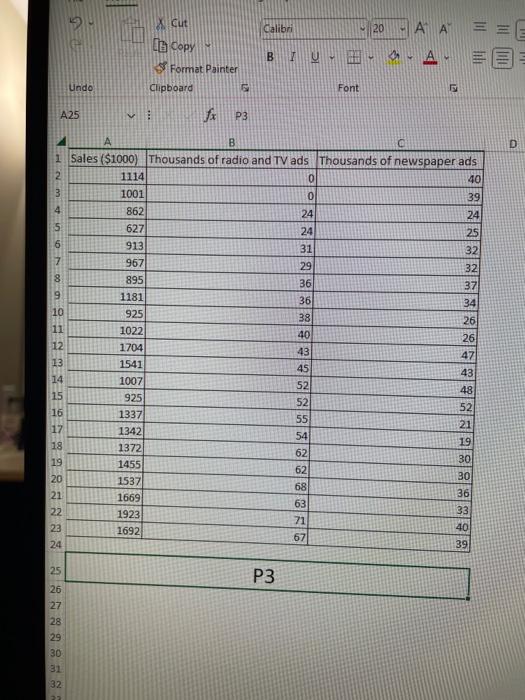
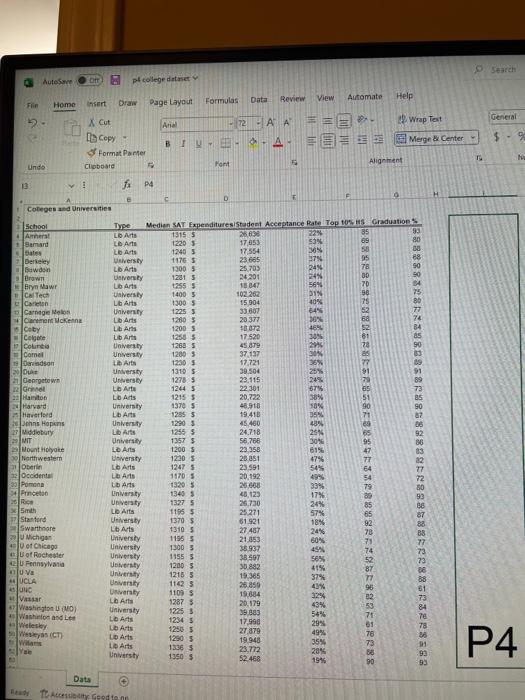
Instructions: Simple \&. Multiple Regression Homework - Gownload the attached datasets to complete the assignment. - Perform your analysis in an Excel file. Following the examples in the lectures and tutorial clearly show your work. Highlight and clearly label your solutions for easy identification. - Clearly name your Excel solution files and upload them online on Blackboard. P1. The managing director of a consulting group has the accompanying monthly data (see attached file " p1 consulting dataset x isx") on total overhead costs and professional labor hours to bill to clients. Answer the following questions (all in the same Excel file and highlight in red): - Develop a simple linear regression model between billable hours (X variable) and overhead costs ( Y variable) - Create the Line Fit Plot when running the regression. As shown in the futorial, add a trendline to the data, show the Regression equation and the coefficient of determination on the plot. - Describe and clearly interpret the coefficient of determination for the model (as shown in the tutorial video) - Check for significance of the model and clearly state your interpretation - Check for significance of the explanatory variable (x) and dearly state your interpretation - What is the slope (coefficient) value of the regression equation? Interpret it dearly as shown in the tutorial. P2. Historic cost data at a popular wedding location is shown in the accomparying file ( p ? wedding dataset x(x). Run a simple regression model using the wedding cost as the dependent variable and attendance as the independent variable. Answer the following questions (all in the same Excel file and hightight in red) - Develop a simple linear regression model between attendance (X variable) and wedding cost (Y variable). - Create the Line Fit Plot when running the regression. As shown in the futorial, add a trendline to the data, show the Regression equation and the coefficient of determination on the plot. - Describe and clearly interpret the coefficient of determination for the model (as shown in the tutorial video) - Check for significance of the model and clearly state your interpretation - Check for significance of the explanatory variable (x) and clearly state your interpretation - What is the slope (coefficient) value of the regression equation? Interpret it clearly as shown in the tutorial. P3. Review the accompanying Concert Sales dataset ( p3 concert sales dataset x (sx) ) on sales: dollars and the number of radio, TV, and newspaper ads promoting the concerts for a group of cities. Answer the following questions (all in the same Excel fille and highlight in red). - First, develop a simple linear regression model for predicting sales as a function of the number of radio and TV ads. Clearly interpret the coefficient of determination, significance of the model and slope of the regression model. - Next, compare these results to a multiple linear regression model using both independent variables. - State the model and interpret the coefficient of determination. What is the change compared to the simple regression model. Explain why. - Write out the multiple regression equation clearly as shown in the tutorial using the form: y=b0+b1(x1)+b2(x2) substituting the correct values for each of the statistic. - Are the independent variables significant? How would you interpret them? P4. Use the accompanying college graduation dataset ( p4 college dalaset x dsix") on admission factors, college characteristics and graduation rates for a group of universities. Answer the following questions (all in the same Excel file and highlight in red): - Run a multiple linear regression model for predicting graduation %(y) as a function of median SAT (x1) and Expenditure/student (x2). - Clearly interpret the coefficient of determination and significance of the model - Write out the multiple regression equation clearly as shown in the tutorial using the form: y=b0+b1(x1)+b2(x2) substituting the correct values for each of the statistic. - Are the independent variables significant? How would you interpret them? - What is your main conclusion about this model
Step by Step Solution
There are 3 Steps involved in it

Get step-by-step solutions from verified subject matter experts