

Question: Please help, I have completed the first and second questionnaires, but I want to solve Question 3) and 4) Please understand me and solve them
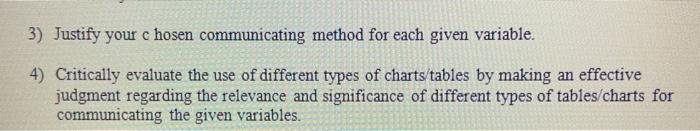
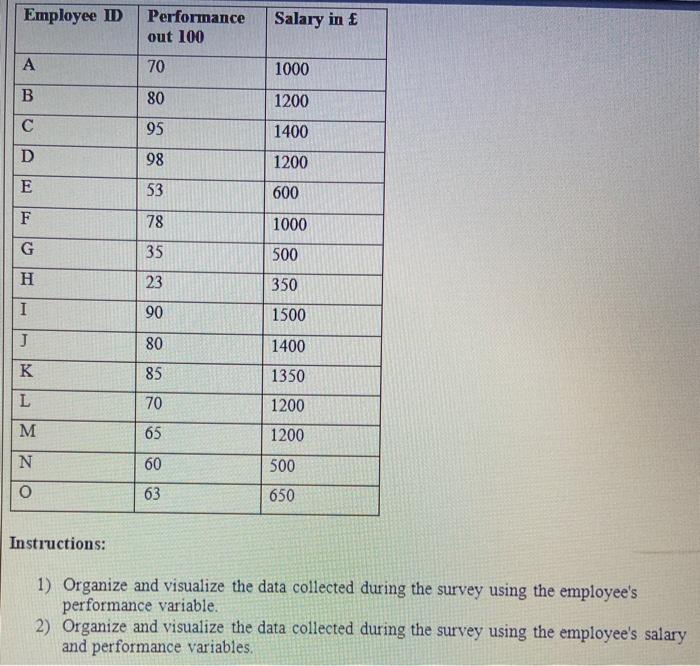
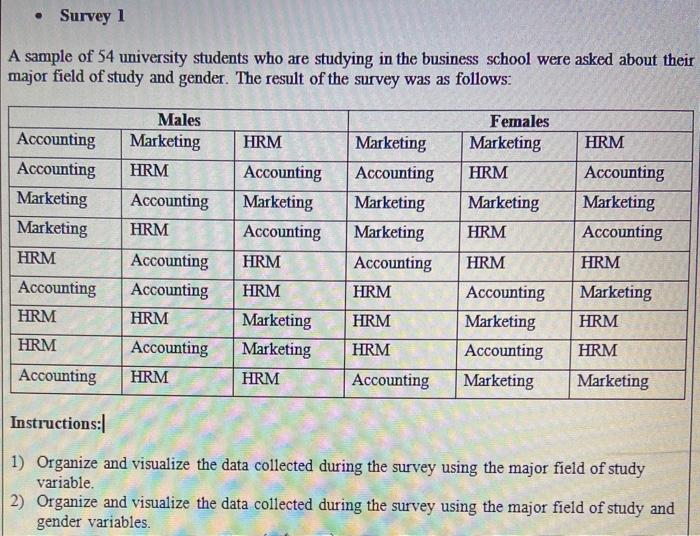
3) Justify your chosen communicating method for each given variable. 4) Critically evaluate the use of different types of charts/tables by making an effective judgment regarding the relevance and significance of different types of tables/charts for communicating the given variables. Employee ID Performance out 100 Salary in A 70 1000 B 80 1200 95 1400 D 98 1200 E 53 600 F 78 1000 G 35 500 H 23 350 I 90 1500 J 80 1400 K 85 1350 L 70 1200 65 1200 o 23 60 500 63 650 Instructions: 1) Organize and visualize the data collected during the survey using the employee's performance variable. 2) Organize and visualize the data collected during the survey using the employee's salary and performance variables. Survey 1 A sample of 54 university students who are studying in the business school were asked about their major field of study and gender. The result of the survey was as follows: Males Marketing HRM Females Marketing HRM HRM HRM Accounting Accounting Marketing Marketing HRM Accounting HRM Marketing Accounting Marketing Accounting Accounting HRM Marketing Accounting Marketing Marketing Accounting HRM HRM Accounting Marketing Accounting HRM Marketing HRM HRM HRM Accounting Accounting HRM Accounting HRM HRM Marketing Marketing HRM HRM Accounting Marketing Accounting Marketing HRM HRM Accounting HRM Accounting Marketing Instructions: 1) Organize and visualize the data collected during the survey using the major field of study variable. 2) Organize and visualize the data collected during the survey using the major field of study and gender variables. 3) Justify your chosen communicating method for each given variable. 4) Critically evaluate the use of different types of charts/tables by making an effective judgment regarding the relevance and significance of different types of tables/charts for communicating the given variables. Employee ID Performance out 100 Salary in A 70 1000 B 80 1200 95 1400 D 98 1200 E 53 600 F 78 1000 G 35 500 H 23 350 I 90 1500 J 80 1400 K 85 1350 L 70 1200 65 1200 o 23 60 500 63 650 Instructions: 1) Organize and visualize the data collected during the survey using the employee's performance variable. 2) Organize and visualize the data collected during the survey using the employee's salary and performance variables. Survey 1 A sample of 54 university students who are studying in the business school were asked about their major field of study and gender. The result of the survey was as follows: Males Marketing HRM Females Marketing HRM HRM HRM Accounting Accounting Marketing Marketing HRM Accounting HRM Marketing Accounting Marketing Accounting Accounting HRM Marketing Accounting Marketing Marketing Accounting HRM HRM Accounting Marketing Accounting HRM Marketing HRM HRM HRM Accounting Accounting HRM Accounting HRM HRM Marketing Marketing HRM HRM Accounting Marketing Accounting Marketing HRM HRM Accounting HRM Accounting Marketing Instructions: 1) Organize and visualize the data collected during the survey using the major field of study variable. 2) Organize and visualize the data collected during the survey using the major field of study and gender variables
Step by Step Solution
There are 3 Steps involved in it

Get step-by-step solutions from verified subject matter experts