

Question: please help me 1) 2) question 2 continue: One of the most important ways for scientists to share their results with others (as well as
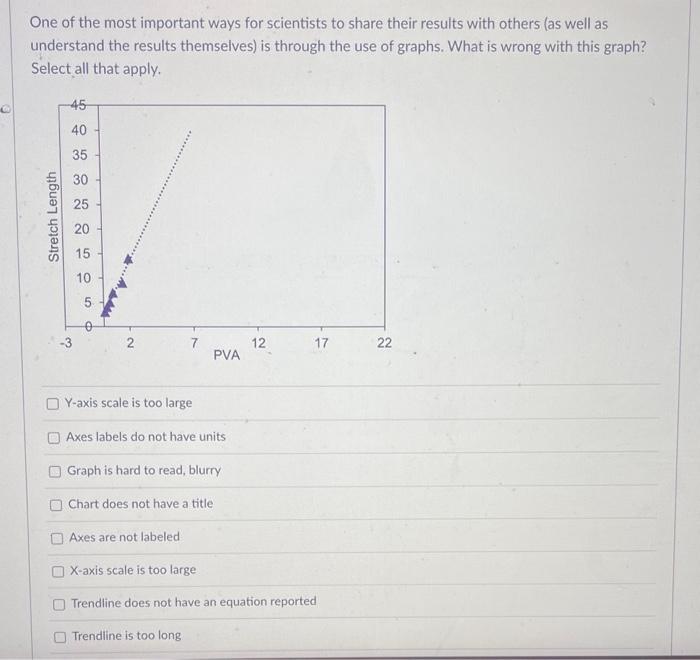
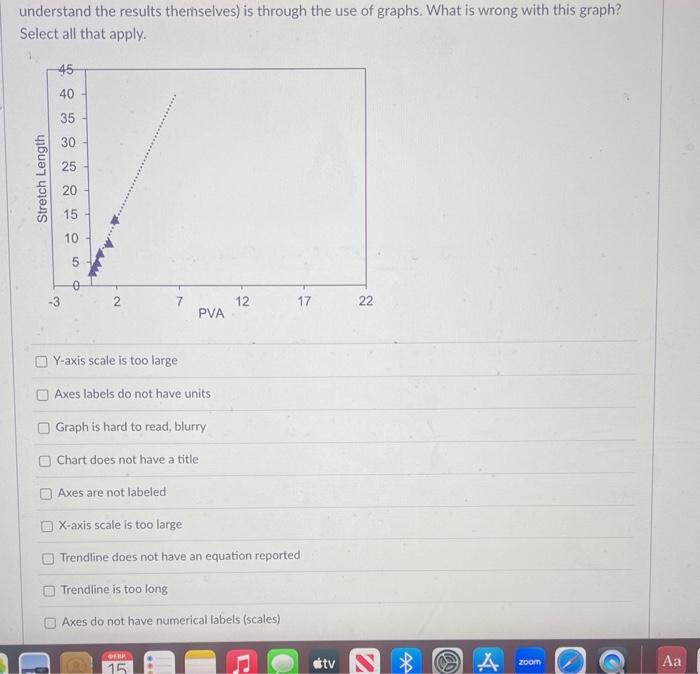
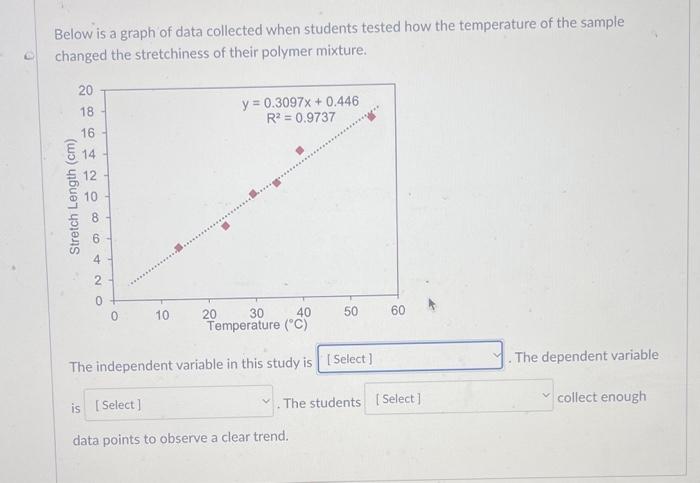
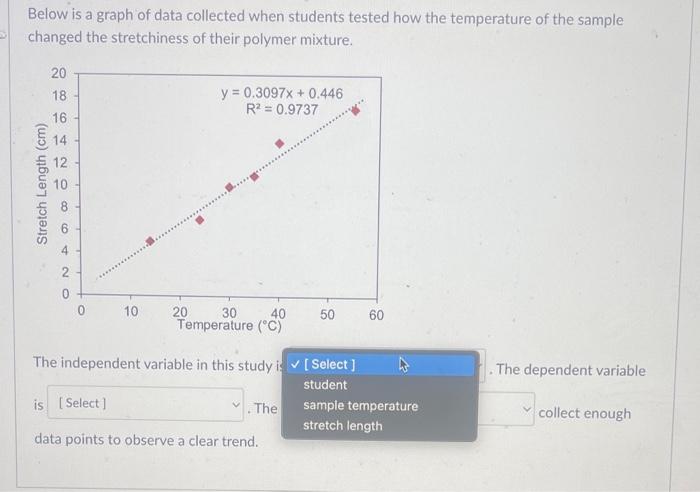
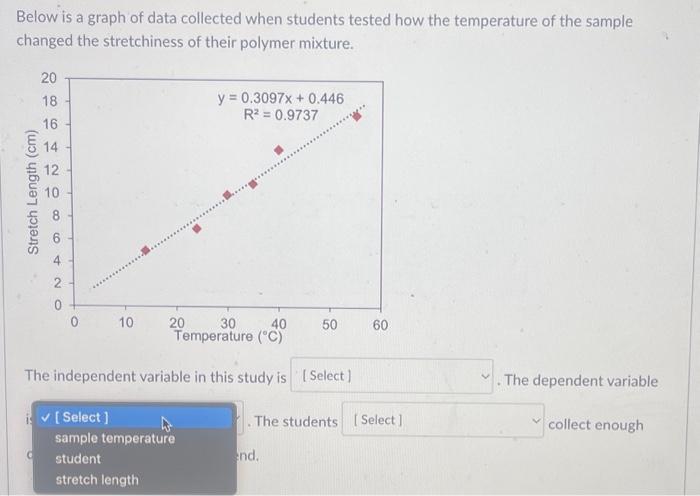
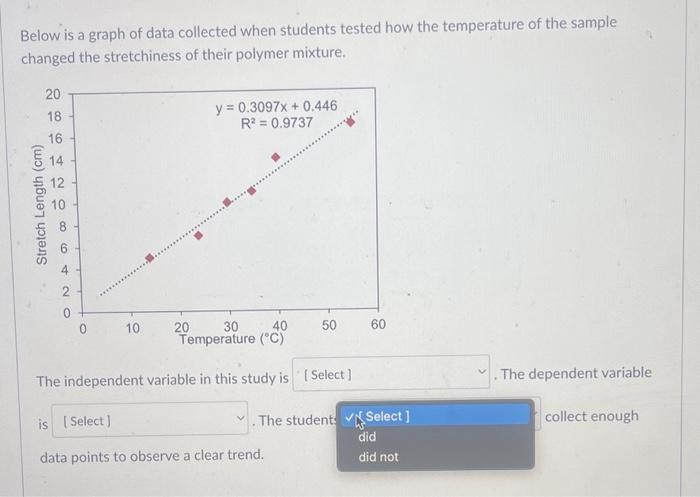
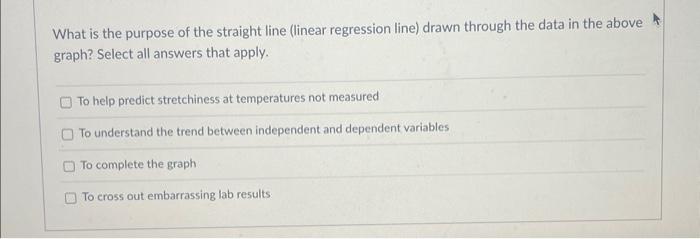
One of the most important ways for scientists to share their results with others (as well as understand the results themselves) is through the use of graphs. What is wrong with this graph? Select all that apply. Y-axis scale is too large Axes labels do not have units Graph is hard to read, blurry Chart does not have a title Axes are not labeled X-axis scale is too large Trendline does not have an equation reported Trendline is too long understand the results themselves) is through the use of graphs. What is wrong with this graph? Select all that apply. Y-axis scale is too large Axes labels do not have units Graph is hard to read, blurry Chart does not have a title Axes are not labeled X-axis scale is too large Trendline does not have an equation reported Trendline is too long Axes do not have numerical labels (scales) Below is a graph of data collected when students tested how the temperature of the sample changed the stretchiness of their polymer mixture. The independent variable in this study is The dependent variable is The students collect enough data points to observe a clear trend. Below is a graph of data collected when students tested how the temperature of the sample changed the stretchiness of their polymer mixture. The independent variable in this study is The dependent variable is .The collect enough data points to observe a clear trend. Below is a graph of data collected when students tested how the temperature of the sample changed the stretchiness of their polymer mixture. The independent variable in this study is The dependent variable The students collect enough nd. Below is a graph of data collected when students tested how the temperature of the sample changed the stretchiness of their polymer mixture. The independent variable in this study is The dependent variable is . The student collect enough data points to observe a clear trend. What is the purpose of the straight line (linear regression line) drawn through the data in the above graph? Select all answers that apply. To help predict stretchiness at temperatures not measured To understand the trend between independent and dependent variables To complete the graph To cross out embarrassing lab results
Step by Step Solution
There are 3 Steps involved in it

Get step-by-step solutions from verified subject matter experts