

Question: Please help me answer the following questions: Question 1 Consider the scatterplot: effectiveness vs net sale profits 1 5 | 10 effectiveness net sale profits
Please help me answer the following questions:
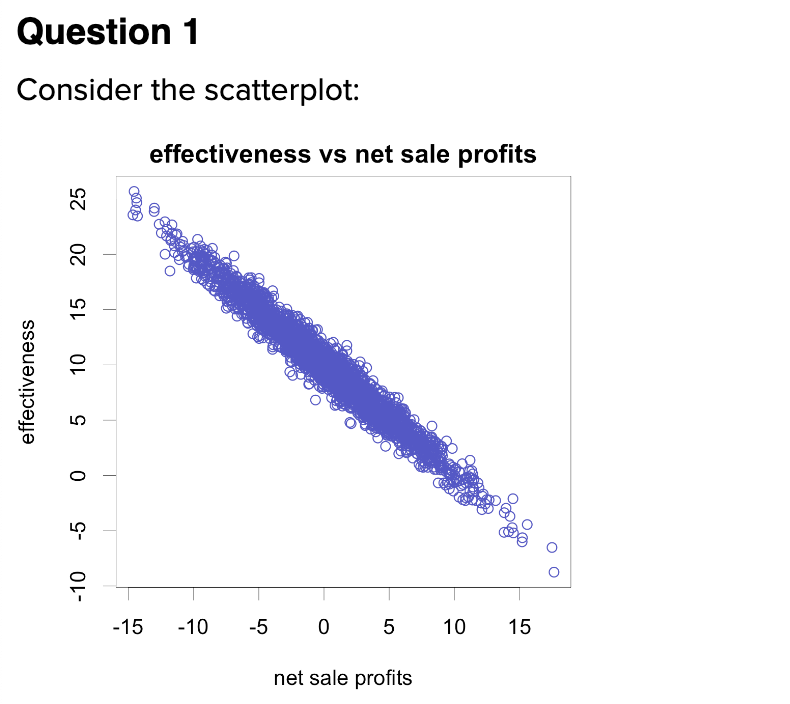

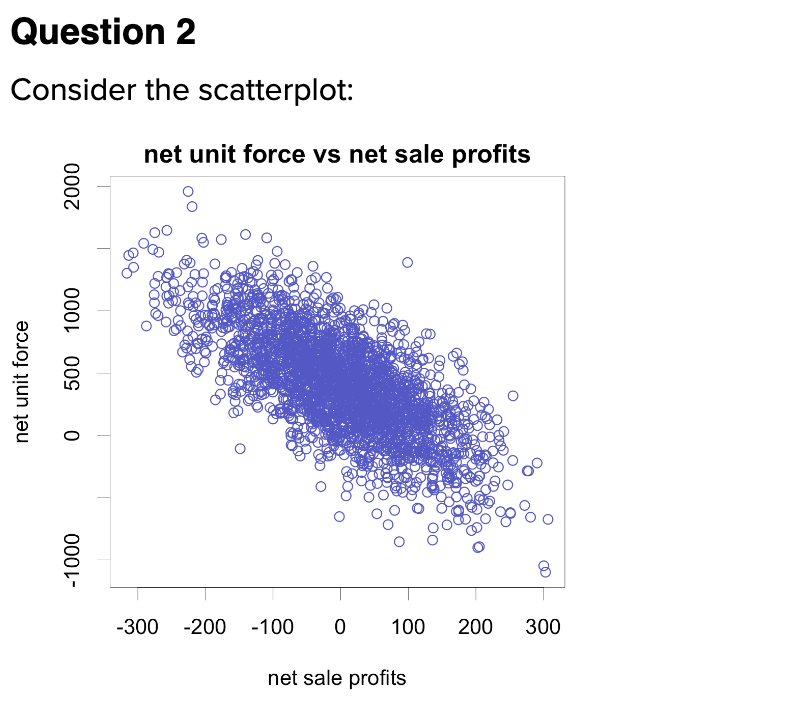
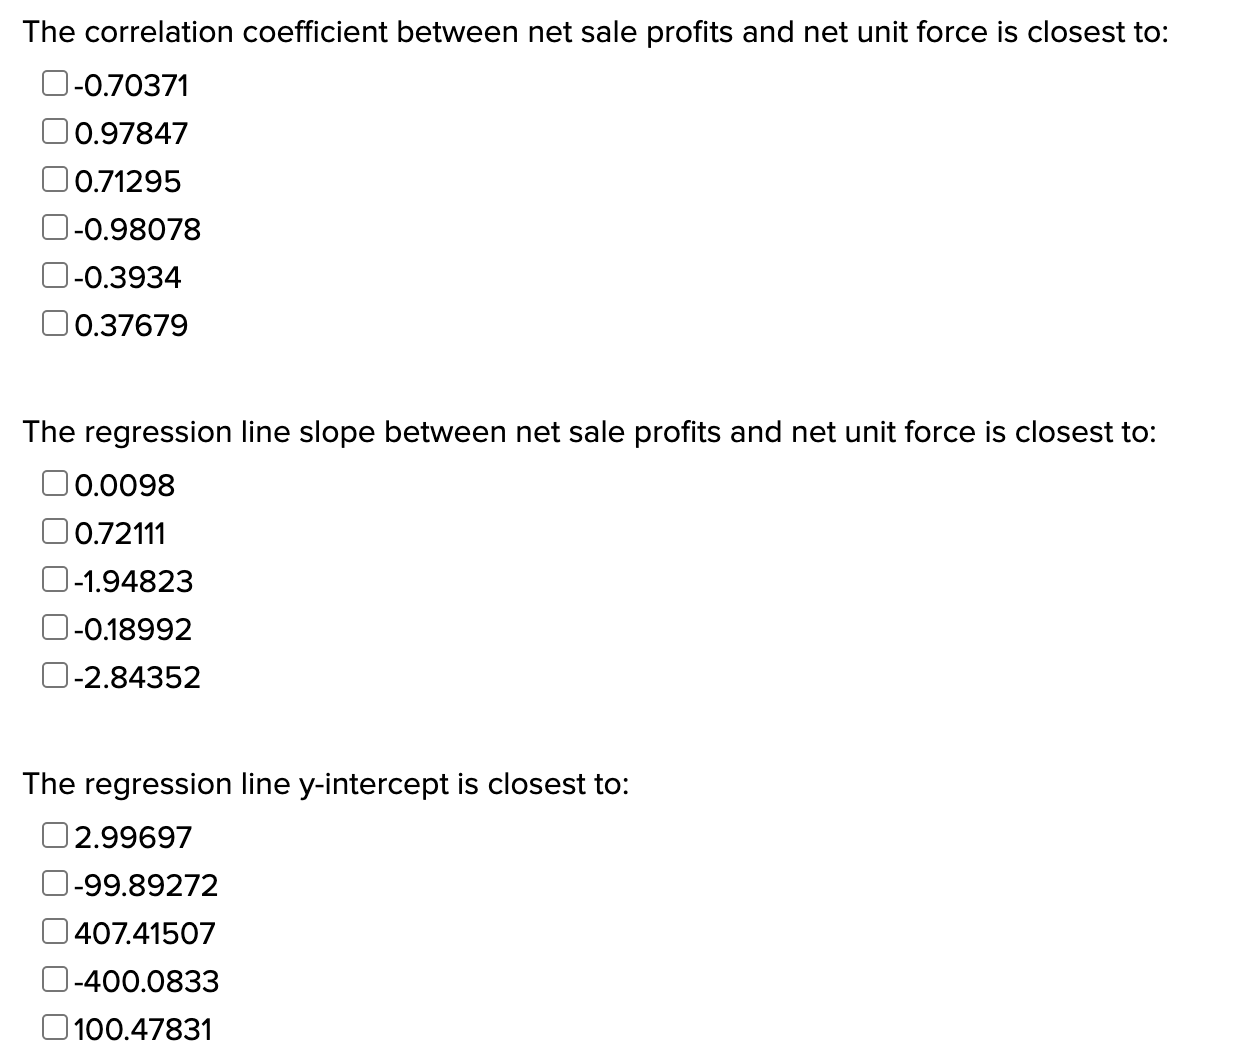
Question 1 Consider the scatterplot: effectiveness vs net sale profits 1 5 | 10 effectiveness net sale profits The correlation coefficient between net sale profits and effectiveness is closest to: 0-0.9801 0 0.68863 0 0.97903 0 0.01162 0-0.71624 0-0.3905 The regression line slope between net sale profits and effectiveness is closest to: 0-0.98147 0-7.87338 39.19215 0 0.1175 0-57.16663 The regression line y-intercept is closest to: 297.85179 0-793.19773 50.15067 10.00367 0-200.47965Question 2 Consider the scatterplot: net unit force vs net sale profits 2 000 | 500 1000 net unit force 0 | -1000 I I I I I -300 -200 -100 0 100 200 300 net sale profits The correlation coefcient between net sale profits and net unit force is closest to: C] -O.70371 C] 0.97847 C] 0.71295 C] -0.98078 C] -0.3934 C] 0.37679 The regression line slope between net sale profits and net unit force is closest to: C] 0.0098 C] 0.72111 C] 4.94823 C] -0.18992 C] -2.84352 The regression line yintercept is closest to: C] 299697 E] -99.89272 C] 40741507 Cl 400.0833 C] 100.47831
Step by Step Solution
There are 3 Steps involved in it

Get step-by-step solutions from verified subject matter experts