

Question: Question 1 Consider the scatterplot: test not vol vs not sale profits last not vol 0 10 -10 not sale prots The correlation coefficient between
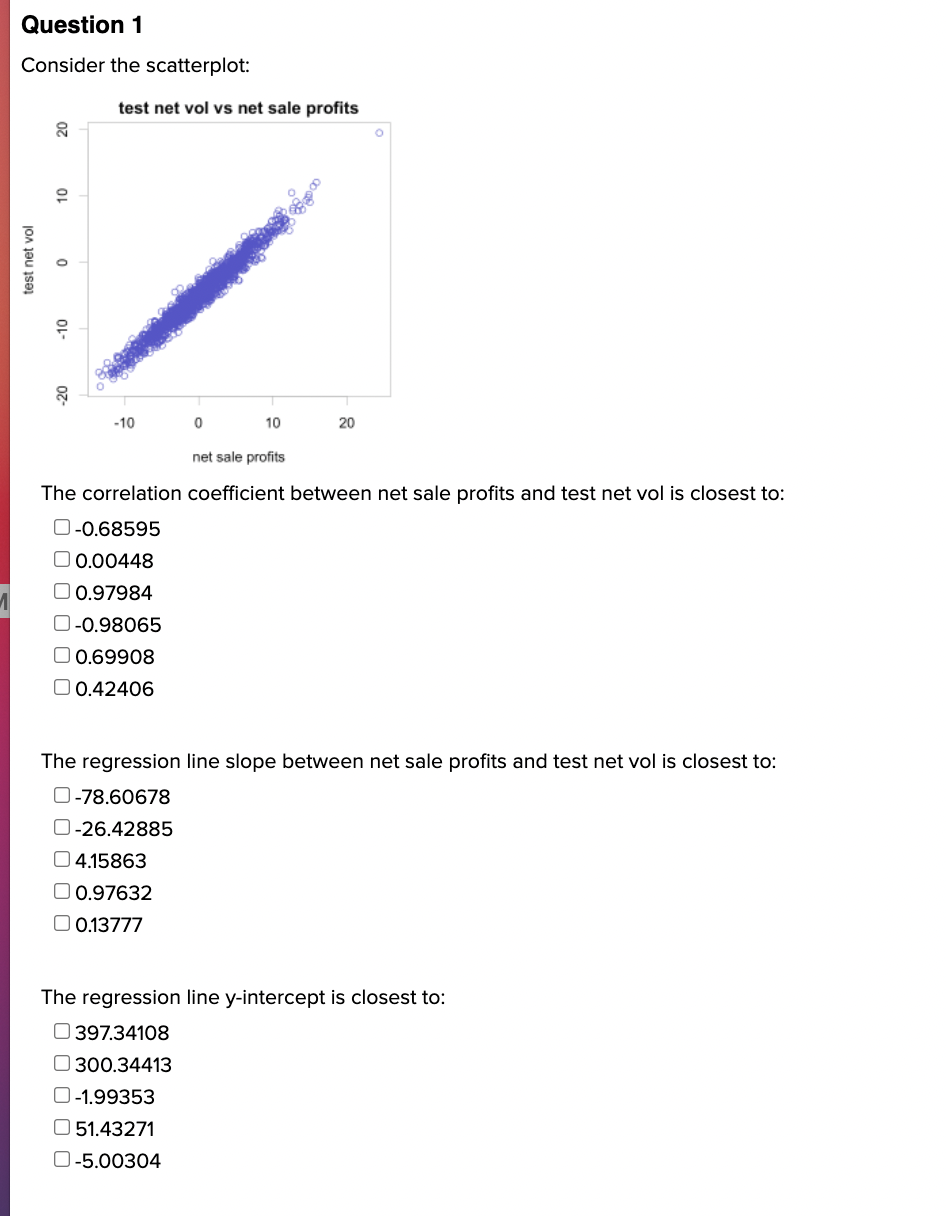

Question 1 Consider the scatterplot: test not vol vs not sale profits last not vol 0 10 -10 not sale prots The correlation coefficient between net sale prots and test net vol is closest to: C] -0.68595 C] 0.00448 C] 0.97984 C] -0.98065 C] 0.69908 C] 042406 The regression line slope between net sale prots and test net vol is closest to: C] -78.60678 C] -26.42885 C] 4.15863 C] 0.97632 C] 013777 The regression line yintercept is closest to: C] 39734108 C] 300.34413 C] 4.99353 C] 51.43271 C] -5.00304
Step by Step Solution
There are 3 Steps involved in it
1 Expert Approved Answer
Step: 1 Unlock

Question Has Been Solved by an Expert!
Get step-by-step solutions from verified subject matter experts
Step: 2 Unlock
Step: 3 Unlock