

Question: Question 1 Consider the scatterplot: net sale profits vs effectiveness 1500 1000 500 net sale profits -500 -20 -10 -5 5 10 15 effectiveness The
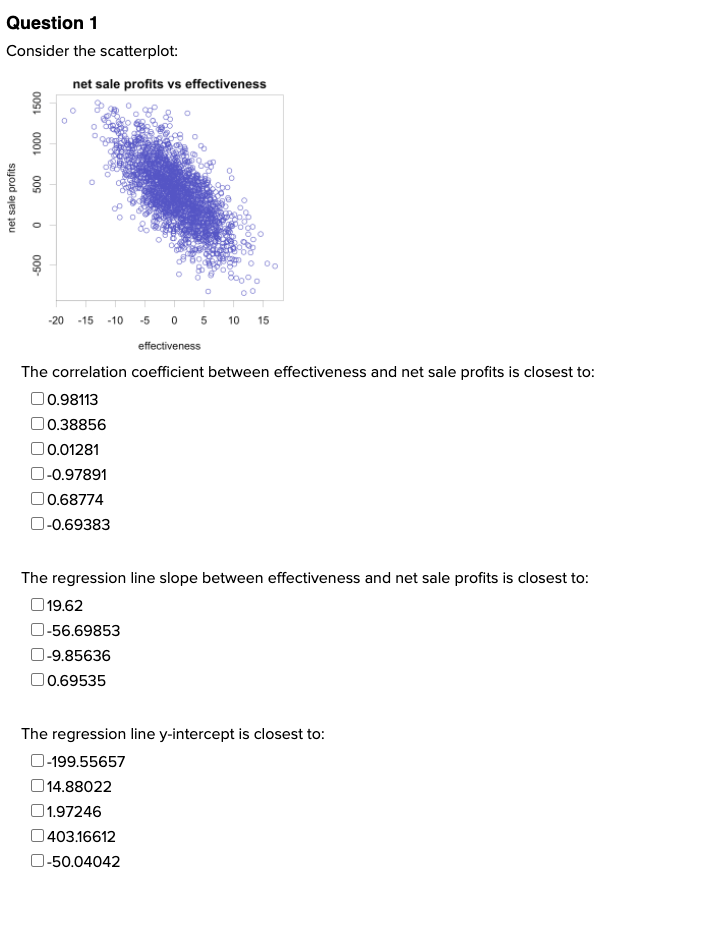
Question 1 Consider the scatterplot: net sale profits vs effectiveness 1500 1000 500 net sale profits -500 -20 -10 -5 5 10 15 effectiveness The correlation coefficient between effectiveness and net sale profits is closest to: 0 0.98113 0 0.38856 00.01281 0-0.97891 0 0.68774 0-0.69383 The regression line slope between effectiveness and net sale profits is closest to: 019.62 0-56.69853 0-9.85636 0 0.69535 The regression line y-intercept is closest to: 0-199.55657 14.88022 01.97246 0403.16612 0-50.04042
Step by Step Solution
There are 3 Steps involved in it
1 Expert Approved Answer
Step: 1 Unlock

Question Has Been Solved by an Expert!
Get step-by-step solutions from verified subject matter experts
Step: 2 Unlock
Step: 3 Unlock