

Question: Please help me answer the question Blooper's analysts have come up with the following revised estimates for its magnoosium mine: Initial investment Revenues Variable costs
Please help me answer the question
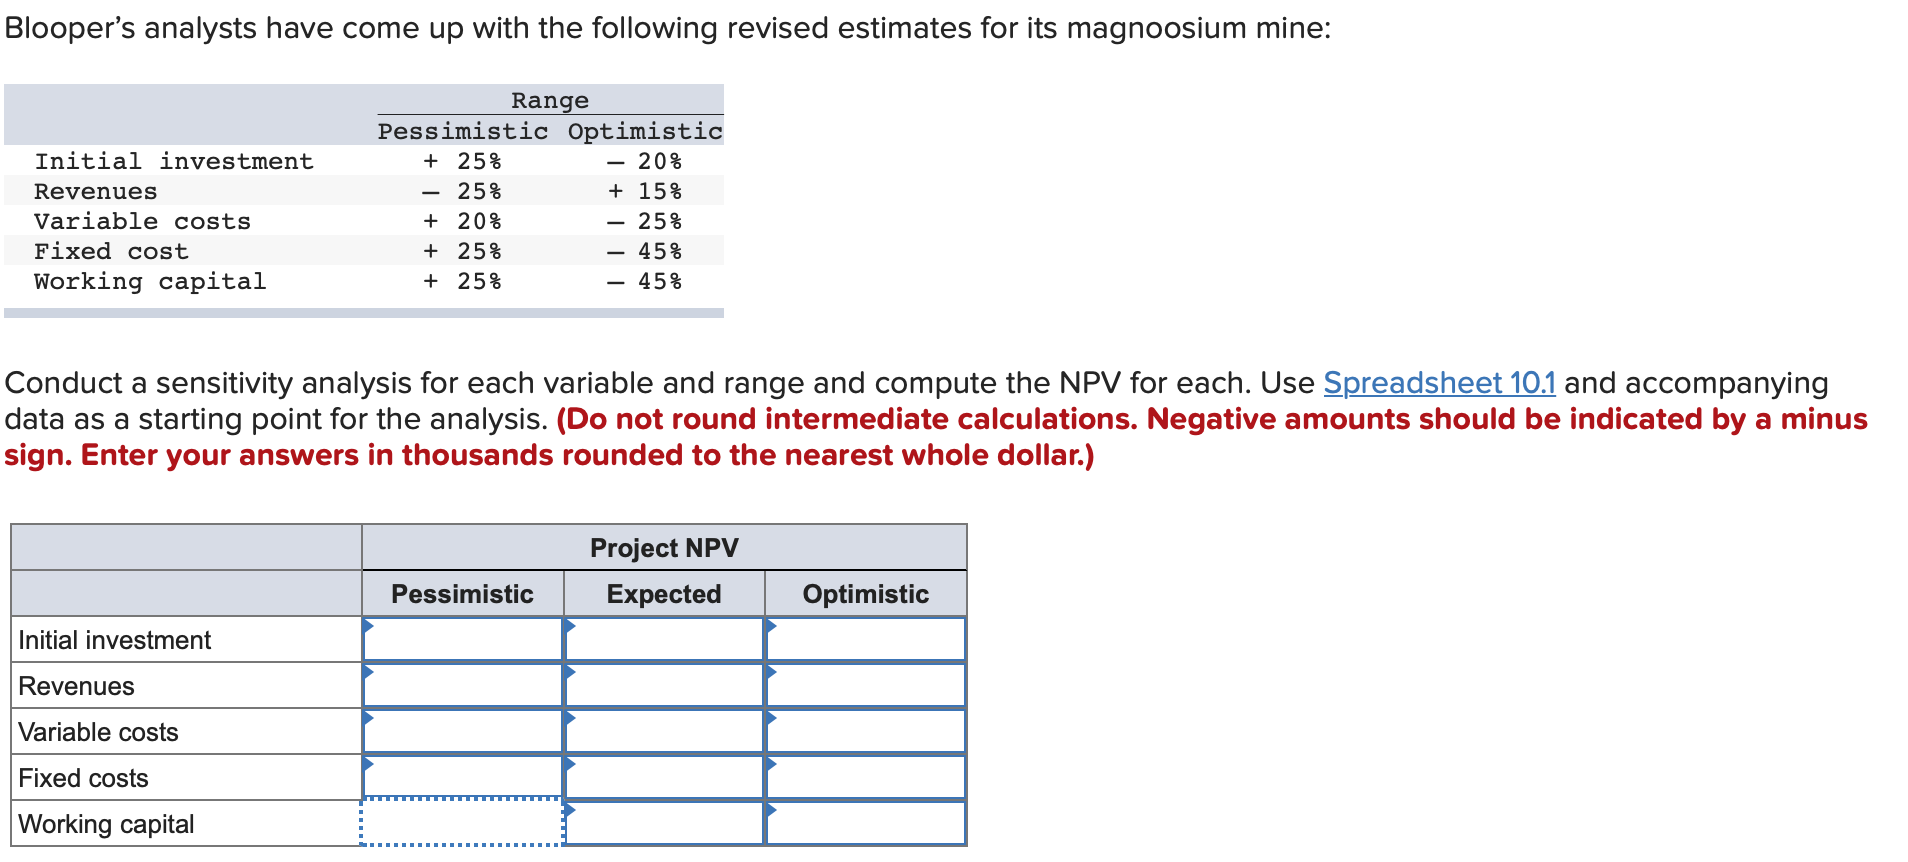
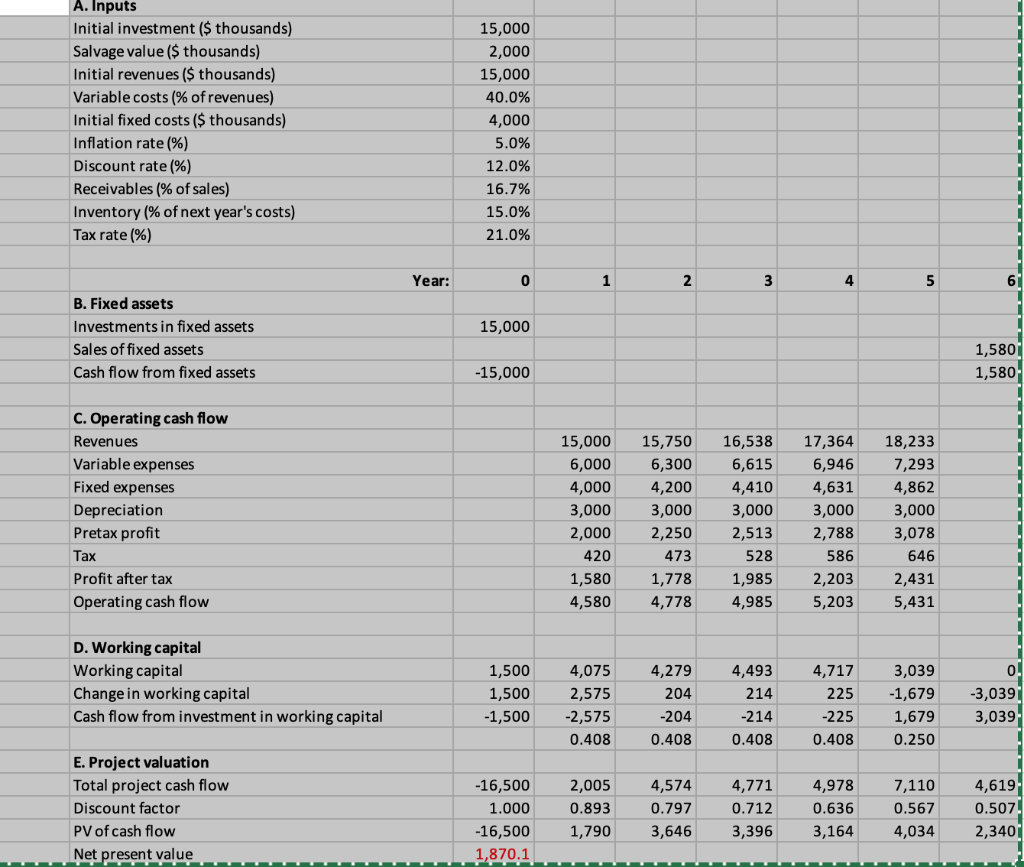
Blooper's analysts have come up with the following revised estimates for its magnoosium mine: Initial investment Revenues Variable costs Fixed cost Working capital Range Pessimistic Optimistic + 25% - 20% - 25% + 15% + 20% 25% + 25% 45% + 25% + + III + - 45% Conduct a sensitivity analysis for each variable and range and compute the NPV for each. Use Spreadsheet 10.1 and accompanying data as a starting point for the analysis. (Do not round intermediate calculations. Negative amounts should be indicated by a minus sign. Enter your answers in thousands rounded to the nearest whole dollar.) Project NPV Expected Pessimistic Optimistic Initial investment Revenues Variable costs Fixed costs Working capital A. Inputs Initial investment ($ thousands) Salvage value ($ thousands) Initial revenues ($ thousands) Variable costs % of revenues) Initial fixed costs ($ thousands) Inflation rate(%) Discount rate (%) Receivables (% of sales) Inventory (% of next year's costs) Tax rate (%) 15,000 2,000 15,000 40.0% 4,000 5.0% 12.0% 16.7% 15.0% 21.0% Year: 0 - 1 2 3 4 5 15,000 B. Fixed assets Investments in fixed assets Sales of fixed assets Cash flow from fixed assets 1,5801 1,580 -15,000 C. Operating cash flow Revenues Variable expenses Fixed expenses Depreciation Pretax profit Tax Profit after tax Operating cash flow 15,000 6,000 4,000 3,000 2,000 420 1,580 4,580 15,750 6,300 4,200 3,000 2,250 473 1,778 4,778 16,538 6,615 4,410 3,000 2,513 528 1,985 4,985 17,364 6,946 4,631 3,000 2,788 586 2,203 5,203 18,233 7,293 4,862 3,000 3,078 646 2,431 5,431 nl D. Working capital Working capital Change in working capital Cash flow from investment in working capital 1,500 1,500 -1,500 - 4,075 2,575 -2,575 0.408 4,279 204 -204 0.408 4,493 214 -214 0.408 4,717 225 -225 0.408 3,039 -1,679 1,679 0.250 -3,0391 3,039; E. Project valuation Total project cash flow Discount factor PV of cash flow Net present value -16,500 1.000 -16,500 1,870.1 2,005 0.893 1,790 4,574 0.797 3,646 4,771 0.712 3,396 4,978 0.636 3,164 7,110 0.567 4,034 4,619. 0.507! 2,340 Blooper's analysts have come up with the following revised estimates for its magnoosium mine: Initial investment Revenues Variable costs Fixed cost Working capital Range Pessimistic Optimistic + 25% - 20% - 25% + 15% + 20% 25% + 25% 45% + 25% + + III + - 45% Conduct a sensitivity analysis for each variable and range and compute the NPV for each. Use Spreadsheet 10.1 and accompanying data as a starting point for the analysis. (Do not round intermediate calculations. Negative amounts should be indicated by a minus sign. Enter your answers in thousands rounded to the nearest whole dollar.) Project NPV Expected Pessimistic Optimistic Initial investment Revenues Variable costs Fixed costs Working capital A. Inputs Initial investment ($ thousands) Salvage value ($ thousands) Initial revenues ($ thousands) Variable costs % of revenues) Initial fixed costs ($ thousands) Inflation rate(%) Discount rate (%) Receivables (% of sales) Inventory (% of next year's costs) Tax rate (%) 15,000 2,000 15,000 40.0% 4,000 5.0% 12.0% 16.7% 15.0% 21.0% Year: 0 - 1 2 3 4 5 15,000 B. Fixed assets Investments in fixed assets Sales of fixed assets Cash flow from fixed assets 1,5801 1,580 -15,000 C. Operating cash flow Revenues Variable expenses Fixed expenses Depreciation Pretax profit Tax Profit after tax Operating cash flow 15,000 6,000 4,000 3,000 2,000 420 1,580 4,580 15,750 6,300 4,200 3,000 2,250 473 1,778 4,778 16,538 6,615 4,410 3,000 2,513 528 1,985 4,985 17,364 6,946 4,631 3,000 2,788 586 2,203 5,203 18,233 7,293 4,862 3,000 3,078 646 2,431 5,431 nl D. Working capital Working capital Change in working capital Cash flow from investment in working capital 1,500 1,500 -1,500 - 4,075 2,575 -2,575 0.408 4,279 204 -204 0.408 4,493 214 -214 0.408 4,717 225 -225 0.408 3,039 -1,679 1,679 0.250 -3,0391 3,039; E. Project valuation Total project cash flow Discount factor PV of cash flow Net present value -16,500 1.000 -16,500 1,870.1 2,005 0.893 1,790 4,574 0.797 3,646 4,771 0.712 3,396 4,978 0.636 3,164 7,110 0.567 4,034 4,619. 0.507! 2,340
Step by Step Solution
There are 3 Steps involved in it

Get step-by-step solutions from verified subject matter experts