

Question: Please help me answer these questions. Step by step detail is required, in order for me to follow. In the following schedule, supposing the actual
Please help me answer these questions. Step by step detail is required, in order for me to follow.
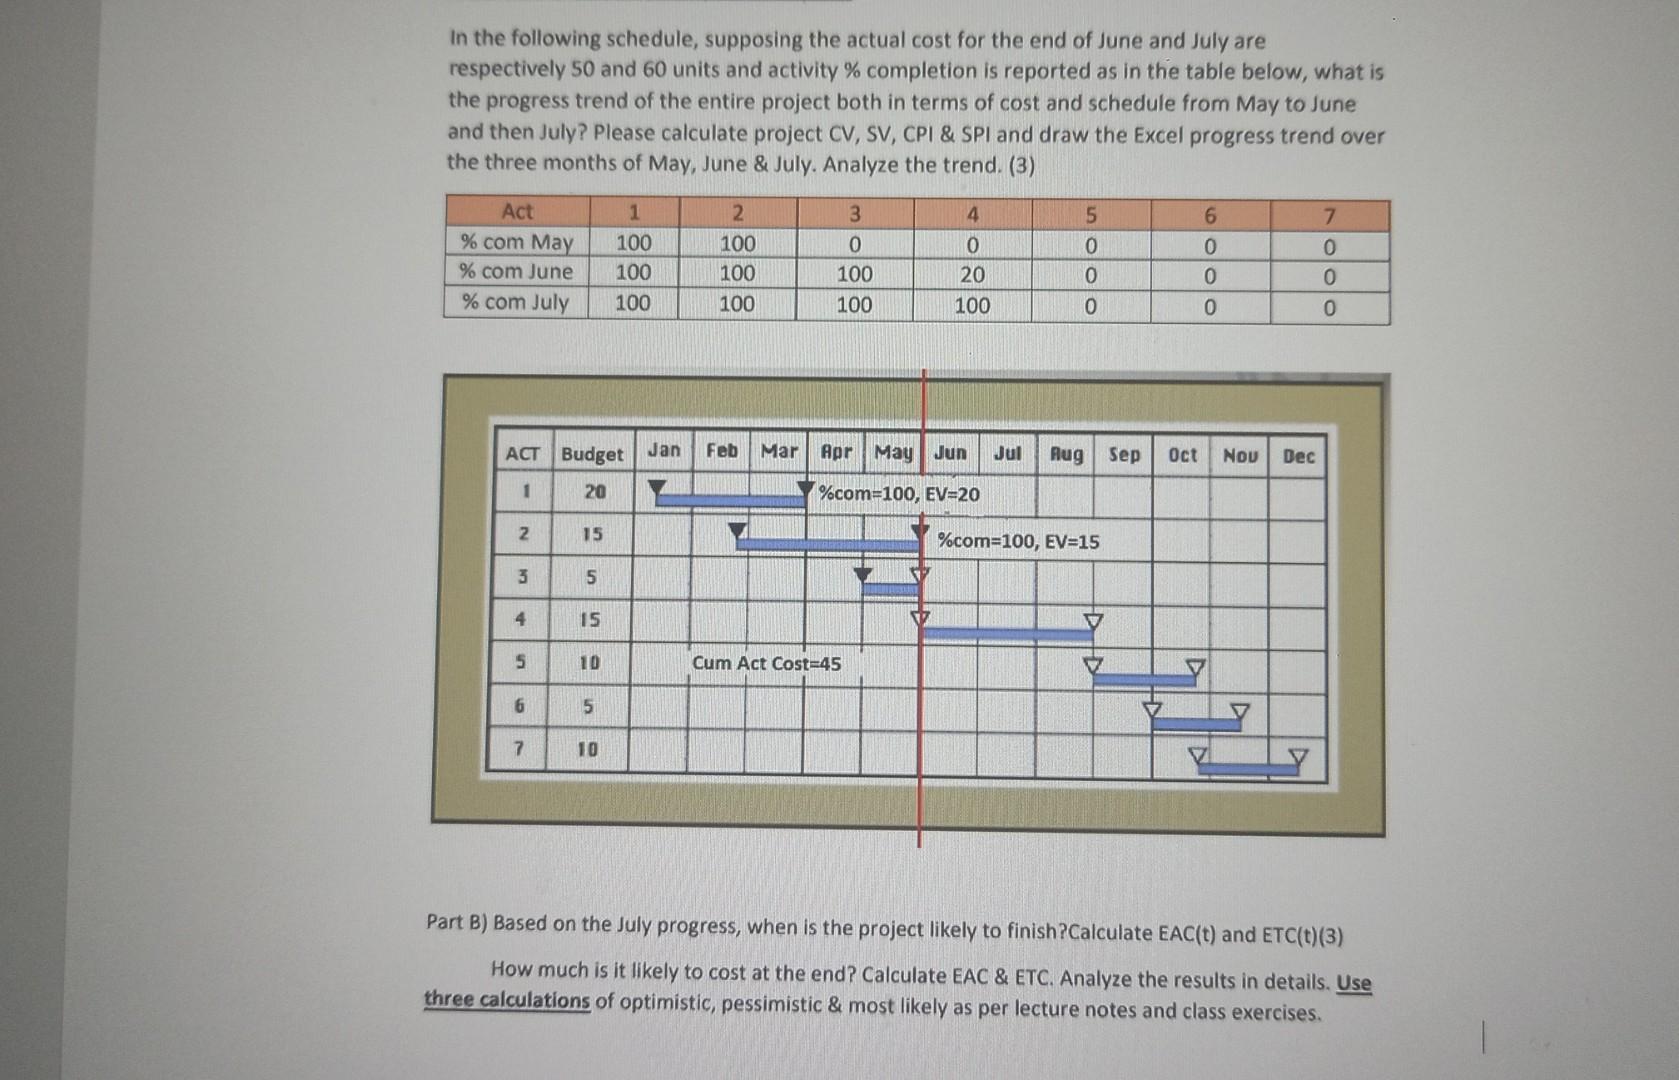
In the following schedule, supposing the actual cost for the end of June and July are respectively 50 and 60 units and activity \% completion is reported as in the table below, what is the progress trend of the entire project both in terms of cost and schedule from May to June and then July? Please calculate project CV, SV, CPI \& SPI and draw the Excel progress trend over the three months of May, June \& July. Analyze the trend. (3) Part B) Based on the July progress, when is the project likely to finish?Calculate EAC(t) and ETC(t)(3) How much is it likely to cost at the end? Calculate EAC \& ETC. Analyze the results in details. Use three calculations of optimistic, pessimistic \& most likely as per lecture notes and class exercisesStep by Step Solution
There are 3 Steps involved in it
1 Expert Approved Answer
Step: 1 Unlock

Question Has Been Solved by an Expert!
Get step-by-step solutions from verified subject matter experts
Step: 2 Unlock
Step: 3 Unlock