

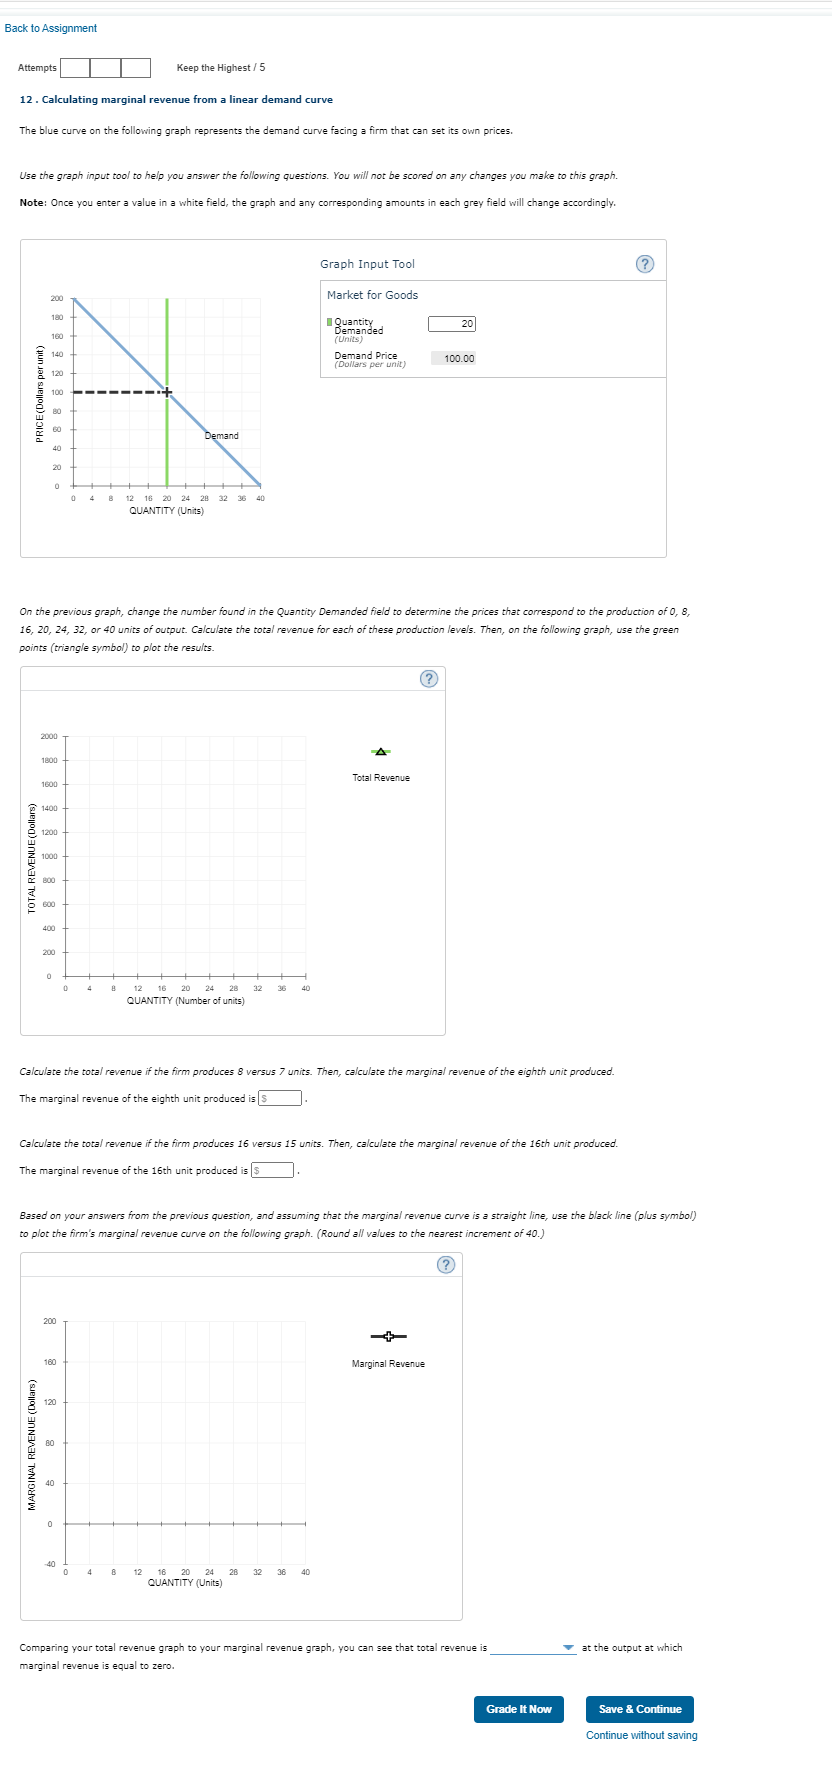
Question: Please help me Back to Assignment Attempts Keep the Highest / 5 12 . Calculating marginal revenue from a linear demand curve The blue curve
Please help me

Back to Assignment Attempts Keep the Highest / 5 12 . Calculating marginal revenue from a linear demand curve The blue curve on the following graph represents the demand curve facing a firm that can set its own prices. Use the graph input tool to help you answer the following questions. You will not be scored on any changes you make to this graph. Note: Once you enter a value in a white field, the graph and any corresponding amounts in each grey field will change accordingly. Graph Input Tool ? Market for Goods IQuantity 20 Demanded (Units) Demand Price Dollars per unit) 100.00 PRICE (Dollars per unit) Demand 12 16 20 24 28 32 QUANTITY (Units) On the previous graph, change the number found in the Quantity Demanded field to determine the prices that correspond to the production of 0, 8, 16, 20, 24, 32, or 40 units of output. Calculate the total revenue for each of these production levels. Then, on the following graph, use the green points (triangle symbol) to plot the results. ? 2000 1800 Total Revenue 1600 1400 1200 TOTAL REVENUE (Dollars) 1000 800 600 400 200 12 16 20 24 28 32 36 QUANTITY (Number of units) Calculate the total revenue if the firm produces 8 versus 7 units. Then, calculate the marginal revenue of the eighth unit produced. The marginal revenue of the eighth unit produced is |s Calculate the total revenue if the firm produces 16 versus 15 units. Then, calculate the marginal revenue of the 16th unit produced. The marginal revenue of the 16th unit produced is $ Based on your answers from the previous question, and assuming that the marginal revenue curve is a straight line, use the black line (plus symbol) to plot the firm's marginal revenue curve on the following graph. (Round all values to the nearest increment of 40.) ? 200 160 Marginal Revenue 120 MARGINAL REVENUE (Dollars) 80 40 0 40 12 20 28 32 36 40 QUANTITY (Units) Comparing your total revenue graph to your marginal revenue graph, you can see that total revenue is at the output at which marginal revenue is equal to zero. Grade It Now Save & Continue Continue without saving
Step by Step Solution
There are 3 Steps involved in it

Get step-by-step solutions from verified subject matter experts