

Question: Please help me fill in the Excel Sheet. I have the information provided below the Excel sheets that have blank spots. I have been having
Please help me fill in the Excel Sheet. I have the information provided below the Excel sheets that have blank spots. I have been having a hard time figuring things out. Please help! I have included the horizontal and vertical ratios that I did in class.
This is all the information that was given to me from class.
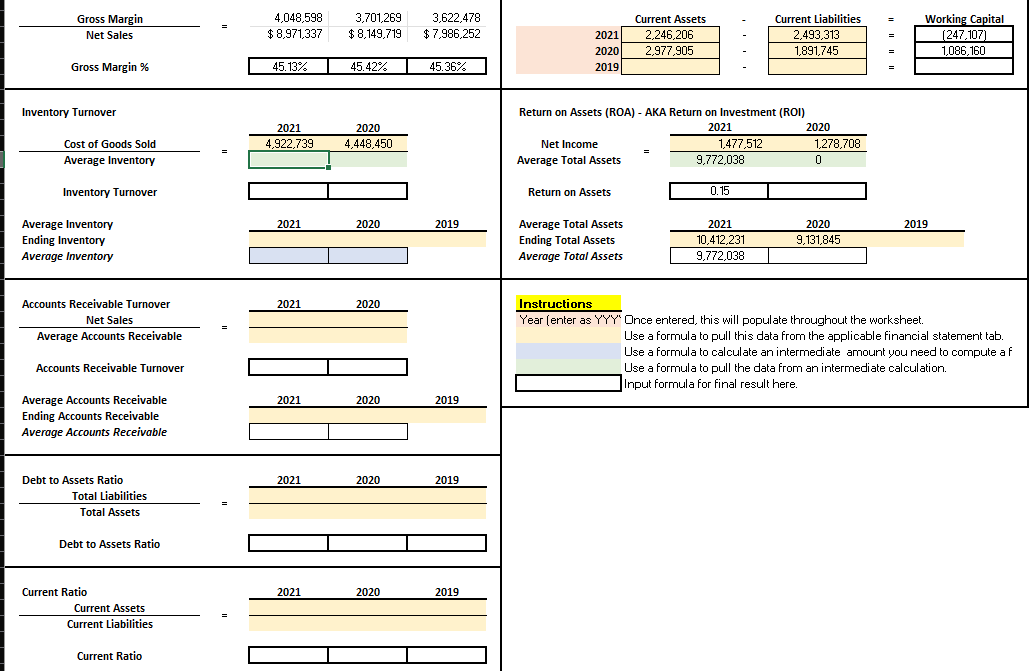
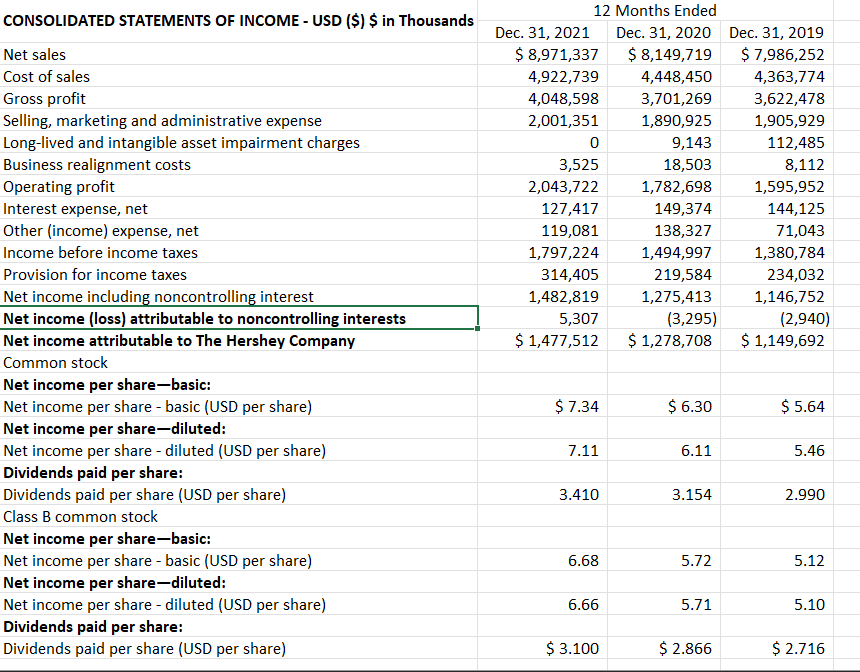
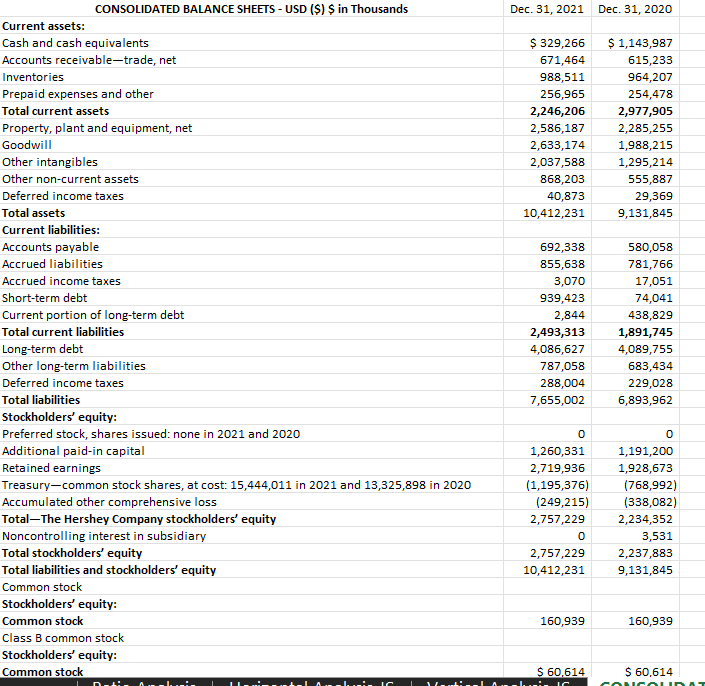
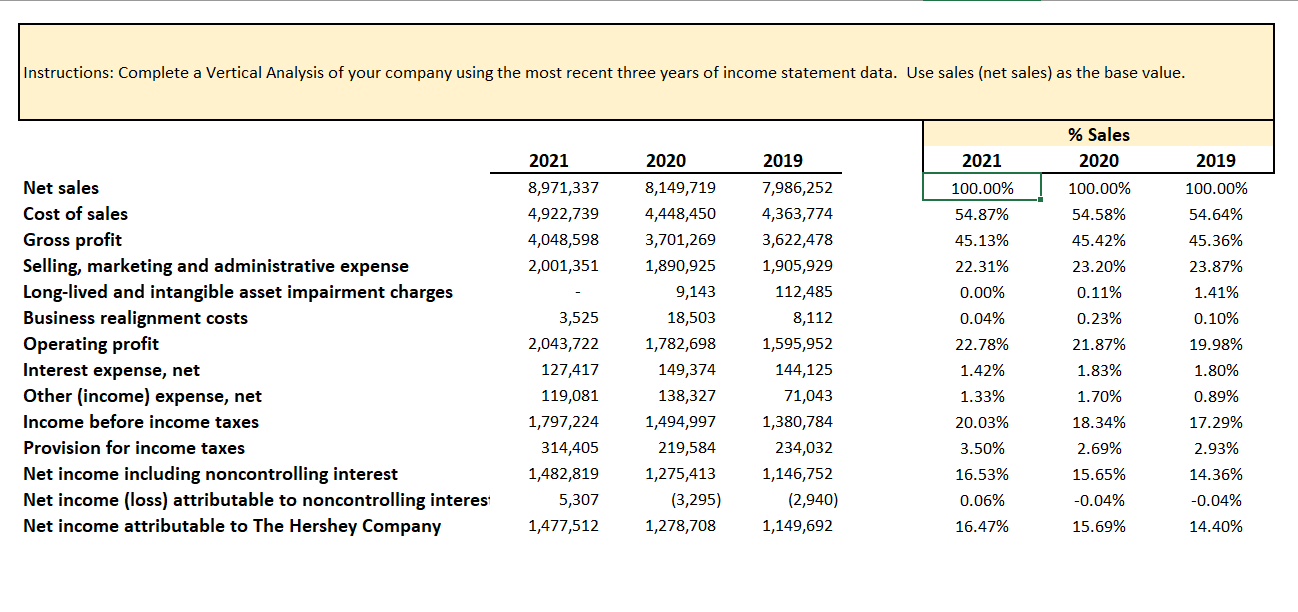
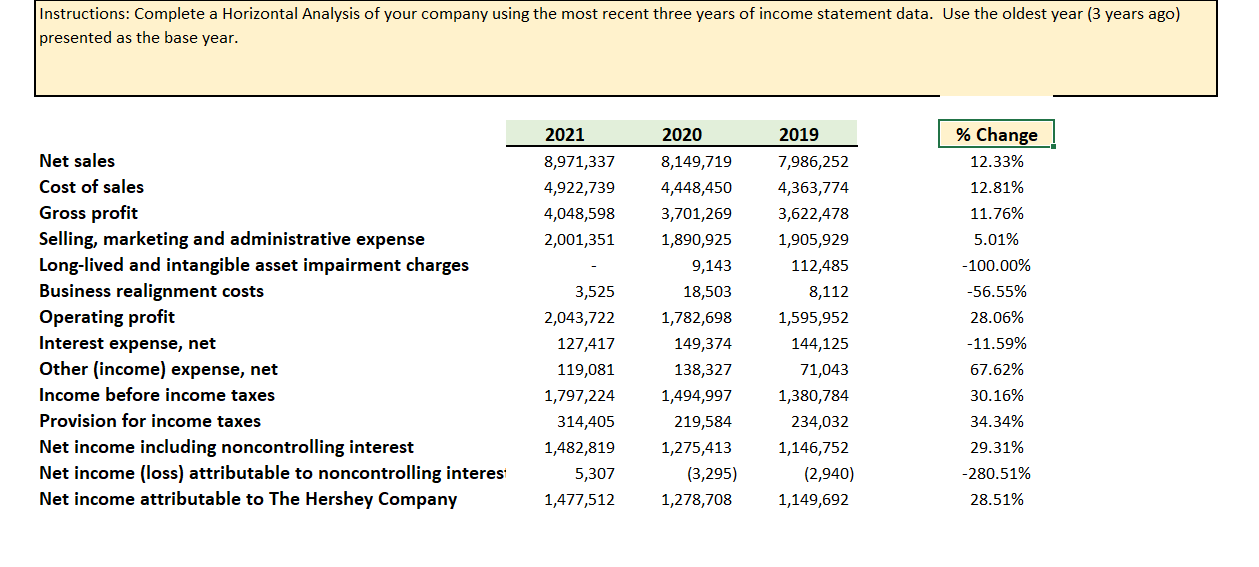
Gross Margin Net Sales Gross Margin % Cost of Goods Sold Average Inventory Inventory Turnover Inventory Turnover Average Inventory Ending Inventory Average Inventory Accounts Receivable Turnover Net Sales Average Accounts Receivable Accounts Receivable Turnover Average Accounts Receivable Ending Accounts Receivable Average Accounts Receivable Debt to Assets Ratio Total Liabilities Total Assets Debt to Assets Ratio Current Assets Current Liabilities Current Ratio Current Ratio 4,048,598 3,701,269 $8,971,337 $8,149,719 45.13% 45.42% 2021 4,922,739 2020 4,448,450 2021 2020 2021 2020 2021 2020 2021 2020 2021 2020 3,622,478 $7,986,252 45.36% 2019 2019 2019 2019 Current Liabilities 2,493,313 1,891,745 1,278,708 0 Current Assets 2,246,206 2021 2020 2019 2,977,905 Return on Assets (ROA) - AKA Return on Investment (ROI) 2021 2020 1,477,512 Net Income Average Total Assets 9,772,038 Return on Assets 0.15 Average Total Assets 2021 2020 2019 10,412,231 9,131,845 Ending Total Assets Average Total Assets 9,772,038 Instructions Year (enter as YYY' Once entered, this will populate throughout the worksheet. = = Working Capital (247,107) 1,086,160 Use a formula to pull this data from the applicable financial statement tab. Use a formula to calculate an intermediate amount you need to compute a f Use a formula to pull the data from an intermediate calculation. Input formula for final result here. CONSOLIDATED STATEMENTS OF INCOME - USD ($) $ in Thousands Net sales Cost of sales Gross profit Selling, marketing and administrative expense Long-lived and intangible asset impairment charges Business realignment costs Operating profit Interest expense, net Other (income) expense, net Income before income taxes Provision for income taxes Net income including noncontrolling interest Net income (loss) attributable to noncontrolling interests Net income attributable to The Hershey Company Common stock Net income per share-basic: Net income per share - basic (USD per share) Net income per share-diluted: Net income per share - diluted (USD per share) Dividends paid per share: Dividends paid per share (USD per share) Class B common stock Net income per share-basic: Net income per share - basic (USD per share) Net income per share-diluted: Net income per share - diluted (USD per share) Dividends paid per share: Dividends paid per share (USD per share) Dec. 31, 2021 12 Months Ended Dec. 31, 2020 $ 8,149,719 4,448,450 3,701,269 1,890,925 9,143 18,503 1,782,698 149,374 138,327 1,494,997 219,584 1,275,413 (3,295) $ 1,278,708 $ 6.30 6.11 3.154 5.72 5.71 $ 2.866 $ 8,971,337 4,922,739 4,048,598 2,001,351 0 3,525 2,043,722 127,417 119,081 1,797,224 314,405 1,482,819 5,307 $ 1,477,512 $ 7.34 7.11 3.410 6.68 6.66 $ 3.100 Dec. 31, 2019 $ 7,986,252 4,363,774 3,622,478 1,905,929 112,485 8,112 1,595,952 144,125 71,043 1,380,784 234,032 1,146,752 (2,940) $ 1,149,692 $ 5.64 5.46 2.990 5.12 5.10 $ 2.716 CONSOLIDATED BALANCE SHEETS- USD ($) $ in Thousands Current assets: Cash and cash equivalents Accounts receivable-trade, net Inventories Prepaid expenses and other Total current assets Property, plant and equipment, net Goodwill Other intangibles Other non-current assets Deferred income taxes Total assets Current liabilities: Accounts payable Accrued liabilities Accrued income taxes Short-term debt Current portion of long-term debt Total current liabilities Long-term debt Other long-term liabilities Deferred income taxes Total liabilities Stockholders' equity: Preferred stock, shares issued: none in 2021 and 2020 Additional paid-in capital Retained earnings Treasury-common stock shares, at cost: 15,444,011 in 2021 and 13,325,898 in 2020 Accumulated other comprehensive loss Total-The Hershey Company stockholders' equity Noncontrolling interest in subsidiary Total stockholders' equity Total liabilities and stockholders' equity Common stock Stockholders' equity: Common stock Class B common stock Stockholders' equity: Common stock D-di- Abi. Ali. IC A Dec. 31, 2021 Dec. 31, 2020 $ 1,143,987 $ 329,266 671,464 615,233 988,511 964,207 256,965 254,478 2,246,206 2,977,905 2,586,187 2,285,255 2,633,174 1,988,215 2,037,588 1,295,214 868,203 555,887 40,873 29,369 10,412,231 9,131,845 692,338 580,058 855,638 781,766 3,070 17,051 939,423 74,041 2,844 438,829 2,493,313 1,891,745 4,086,627 4,089,755 787,058 683,434 288,004 229,028 7,655,002 6,893,962 0 0 1,260,331 1,191,200 2,719,936 1,928,673 (1,195,376) (768,992) (249,215) (338,082) 2,757,229 2,234,352 0 3,531 2,757,229 2,237,883 10,412,231 9,131,845 160,939 160,939 $ 60,614 $ 60,614 I Ventilatori IC CONCO Instructions: Complete a Vertical Analysis of your company using the most recent three years of income statement data. Use sales (net sales) as the base value. % Sales 2020 2021 2019 2021 8,971,337 4,922,739 4,048,598 2,001,351 100.00% 54.87% 45.13% 100.00% 54.58% 100.00% 54.64% 45.36% 23.87% 1.41% 45.42% 23.20% 0.11% 22.31% Net sales Cost of sales Gross profit Selling, marketing and administrative expense Long-lived and intangible asset impairment charges Business realignment costs Operating profit Interest expense, net Other (income) expense, net Income before income taxes Provision for income taxes Net income including noncontrolling interest Net income (loss) attributable to noncontrolling interes Net income attributable to The Hershey Company 2020 8,149,719 4,448,450 3,701,269 1,890,925 9,143 18,503 1,782,698 149,374 138,327 1,494,997 219,584 1,275,413 (3,295) 1,278,708 3,525 2,043,722 127,417 119,081 1,797,224 314,405 1,482,819 5,307 1,477,512 0.23% 21.87% 2019 7,986,252 4,363,774 3,622,478 1,905,929 112,485 8,112 1,595,952 144,125 71,043 1,380,784 234,032 1,146,752 (2,940) 1,149,692 0.00% 0.04% 22.78% 1.42% 1.33% 20.03% 3.50% 16.53% 0.06% 16.47% 1.83% 1.70% 18.34% 2.69% 15.65% -0.04% 15.69% 0.10% 19.98% 1.80% 0.89% 17.29% 2.93% 14.36% -0.04% 14.40% Instructions: Complete a Horizontal Analysis of your company using the most recent three years of income statement data. Use the oldest year (3 years ago) presented as the base year. 2021 2020 2019 8,971,337 4,922,739 4,048,598 2,001,351 Net sales Cost of sales Gross profit Selling, marketing and administrative expense Long-lived and intangible asset impairment charges Business realignment costs Operating profit Interest expense, net Other (income) expense, net Income before income taxes Provision for income taxes Net income including noncontrolling interest Net income (loss) attributable to noncontrolling interest Net income attributable to The Hershey Company 3,525 2,043,722 127,417 119,081 1,797,224 314,405 1,482,819 5,307 1,477,512 8,149,719 4,448,450 3,701,269 1,890,925 9,143 18,503 1,782,698 149,374 138,327 1,494,997 219,584 1,275,413 (3,295) 1,278,708 7,986,252 4,363,774 3,622,478 1,905,929 112,485 8,112 1,595,952 144,125 71,043 1,380,784 234,032 1,146,752 (2,940) 1,149,692 % Change 12.33% 12.81% 11.76% 5.01% -100.00% -56.55% 28.06% -11.59% 67.62% 30.16% 34.34% 29.31% -280.51% 28.51%
Step by Step Solution
There are 3 Steps involved in it

Get step-by-step solutions from verified subject matter experts