

Question: Please help me generate this in Matlab. 10 08 H=0, g = 0.2 u=0, 0-1.0,- =0,025.0,- -2, OP=0.5. 06 04 A D 02 00 -1
Please help me generate this in Matlab.
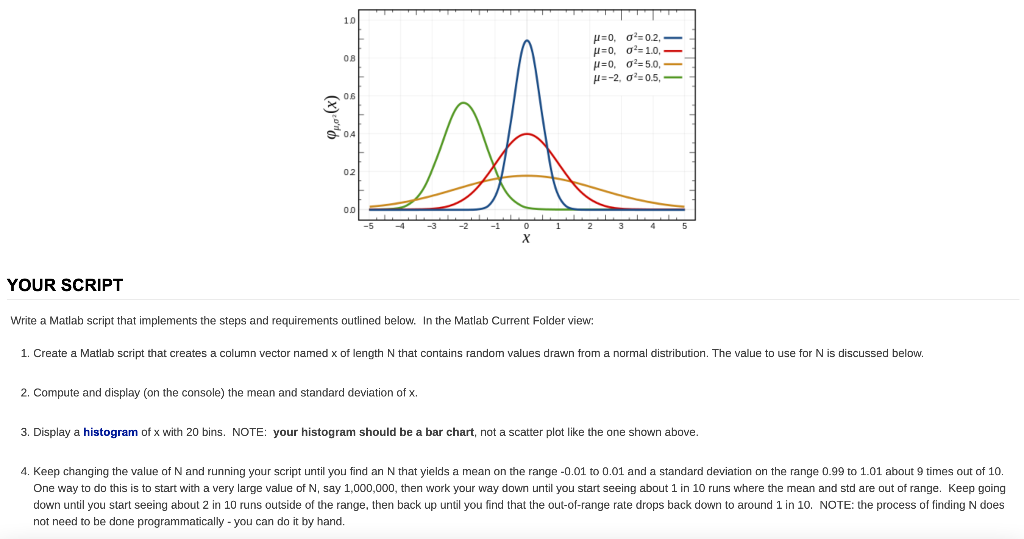
10 08 H=0, g = 0.2 u=0, 0-1.0,- =0,025.0,- -2, OP=0.5. 06 04 A D 02 00 -1 0 1 2 YOUR SCRIPT Write a Matlab script that implements the steps and requirements outlined below. In the Matlab Current Folder view: 1. Create a Matlab script that creates a column vector named x of length N that contains random values drawn from a normal distribution. The value to use for N is discussed below. 2. Compute and display on the console) the mean and standard deviation of x. 3. Display a histogram of x with 20 bins. NOTE: your histogram should be a bar chart, not a scatter plot like the one shown above. 4. Keep changing the value of N and running your script until you find an N that yields a mean on the range -0.01 to 0.01 and a standard deviation on the range 0.99 to 1.01 about 9 times out of 10. One way to do this is to start with a very large value of N, say 1,000,000, then work your way down until you start seeing about 1 in 10 runs where the mean and std are out of range. Keep going down until you start seeing about 2 in 10 runs outside of the range, then back up until you find that the out-of-range rate drops back down to around 1 in 10. NOTE: the process of finding N does not need to be done programmatically - you can do it by hand. 10 08 H=0, g = 0.2 u=0, 0-1.0,- =0,025.0,- -2, OP=0.5. 06 04 A D 02 00 -1 0 1 2 YOUR SCRIPT Write a Matlab script that implements the steps and requirements outlined below. In the Matlab Current Folder view: 1. Create a Matlab script that creates a column vector named x of length N that contains random values drawn from a normal distribution. The value to use for N is discussed below. 2. Compute and display on the console) the mean and standard deviation of x. 3. Display a histogram of x with 20 bins. NOTE: your histogram should be a bar chart, not a scatter plot like the one shown above. 4. Keep changing the value of N and running your script until you find an N that yields a mean on the range -0.01 to 0.01 and a standard deviation on the range 0.99 to 1.01 about 9 times out of 10. One way to do this is to start with a very large value of N, say 1,000,000, then work your way down until you start seeing about 1 in 10 runs where the mean and std are out of range. Keep going down until you start seeing about 2 in 10 runs outside of the range, then back up until you find that the out-of-range rate drops back down to around 1 in 10. NOTE: the process of finding N does not need to be done programmatically - you can do it by hand
Step by Step Solution
There are 3 Steps involved in it

Get step-by-step solutions from verified subject matter experts