

Question: Please help me I cannot figure this out The scatter plot shows the relationship between the number of years an employee has worked and the
Please help me I cannot figure this out
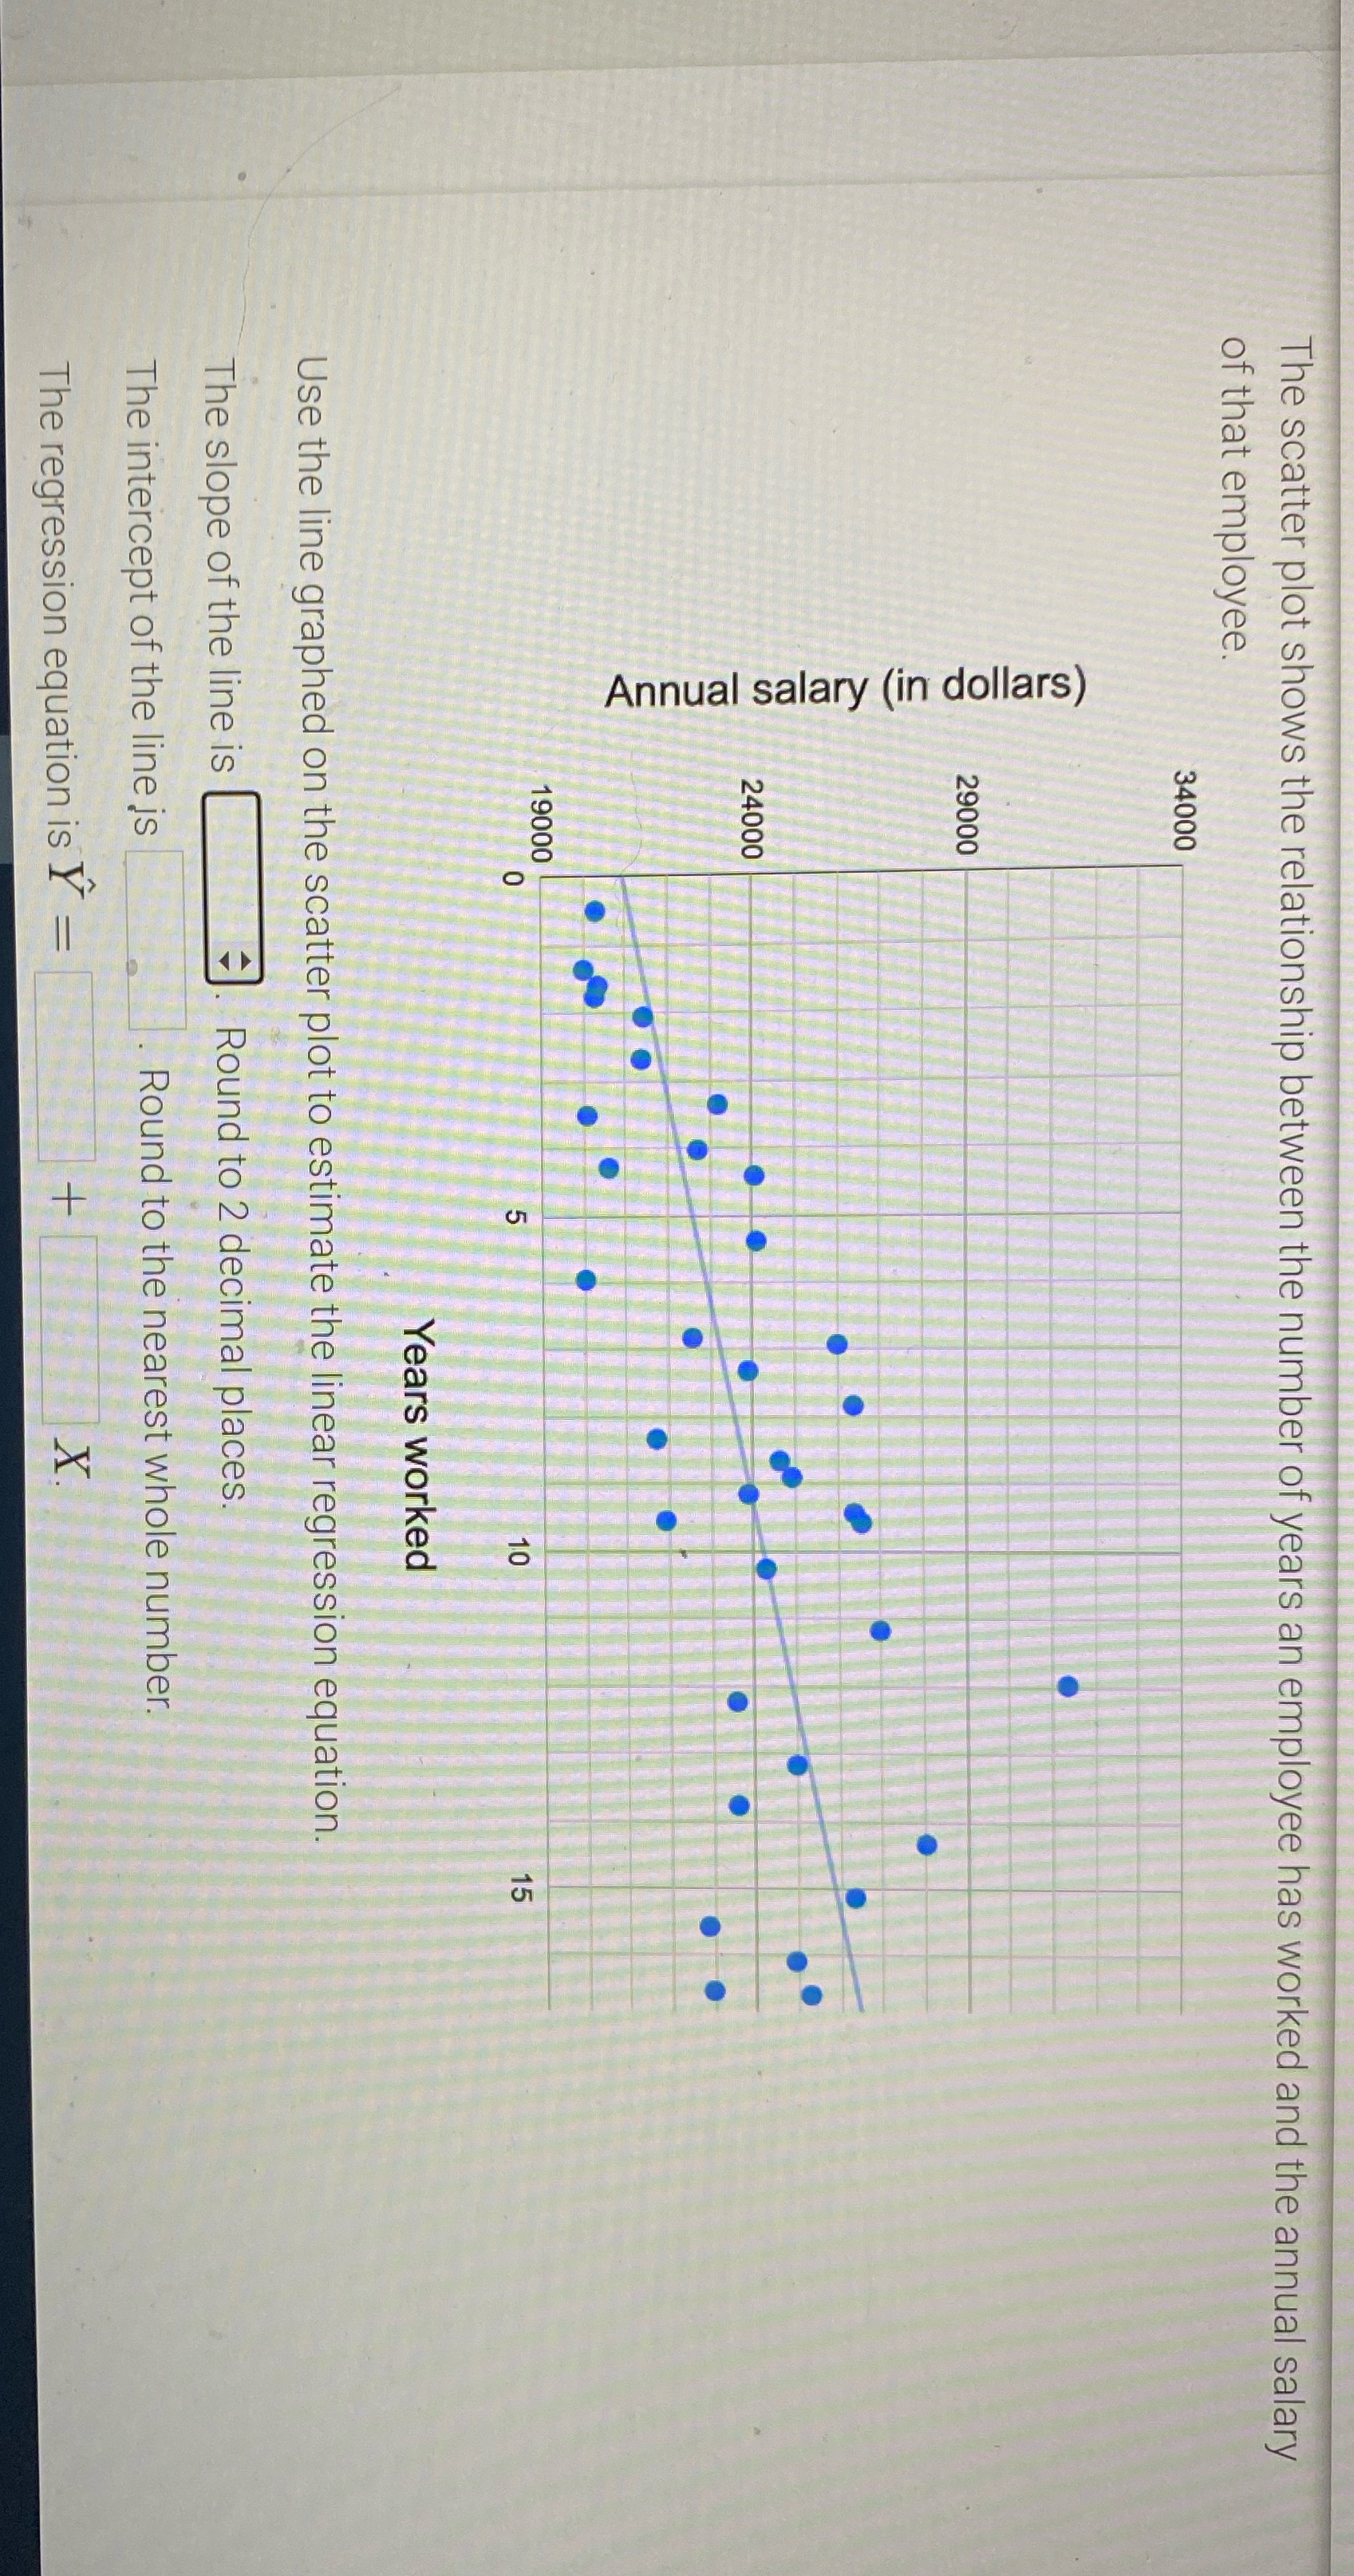
The scatter plot shows the relationship between the number of years an employee has worked and the annual salary of that employee. 34000 29000 Annual salary (in dollars) 24000 19000 O LO LO Years worked Use the line graphed on the scatter plot to estimate the linear regression equation. The slope of the line is Round to 2 decimal places. The intercept of the line is Round to the nearest whole number. The regression equation is Y = +
Step by Step Solution
There are 3 Steps involved in it
1 Expert Approved Answer
Step: 1 Unlock

Question Has Been Solved by an Expert!
Get step-by-step solutions from verified subject matter experts
Step: 2 Unlock
Step: 3 Unlock