

Question: 240: Applied Statistics home > 3.1: Interpreting fitted models EzyBooks ca Jump to level 1 The scatter plot shows the relationship between the number of
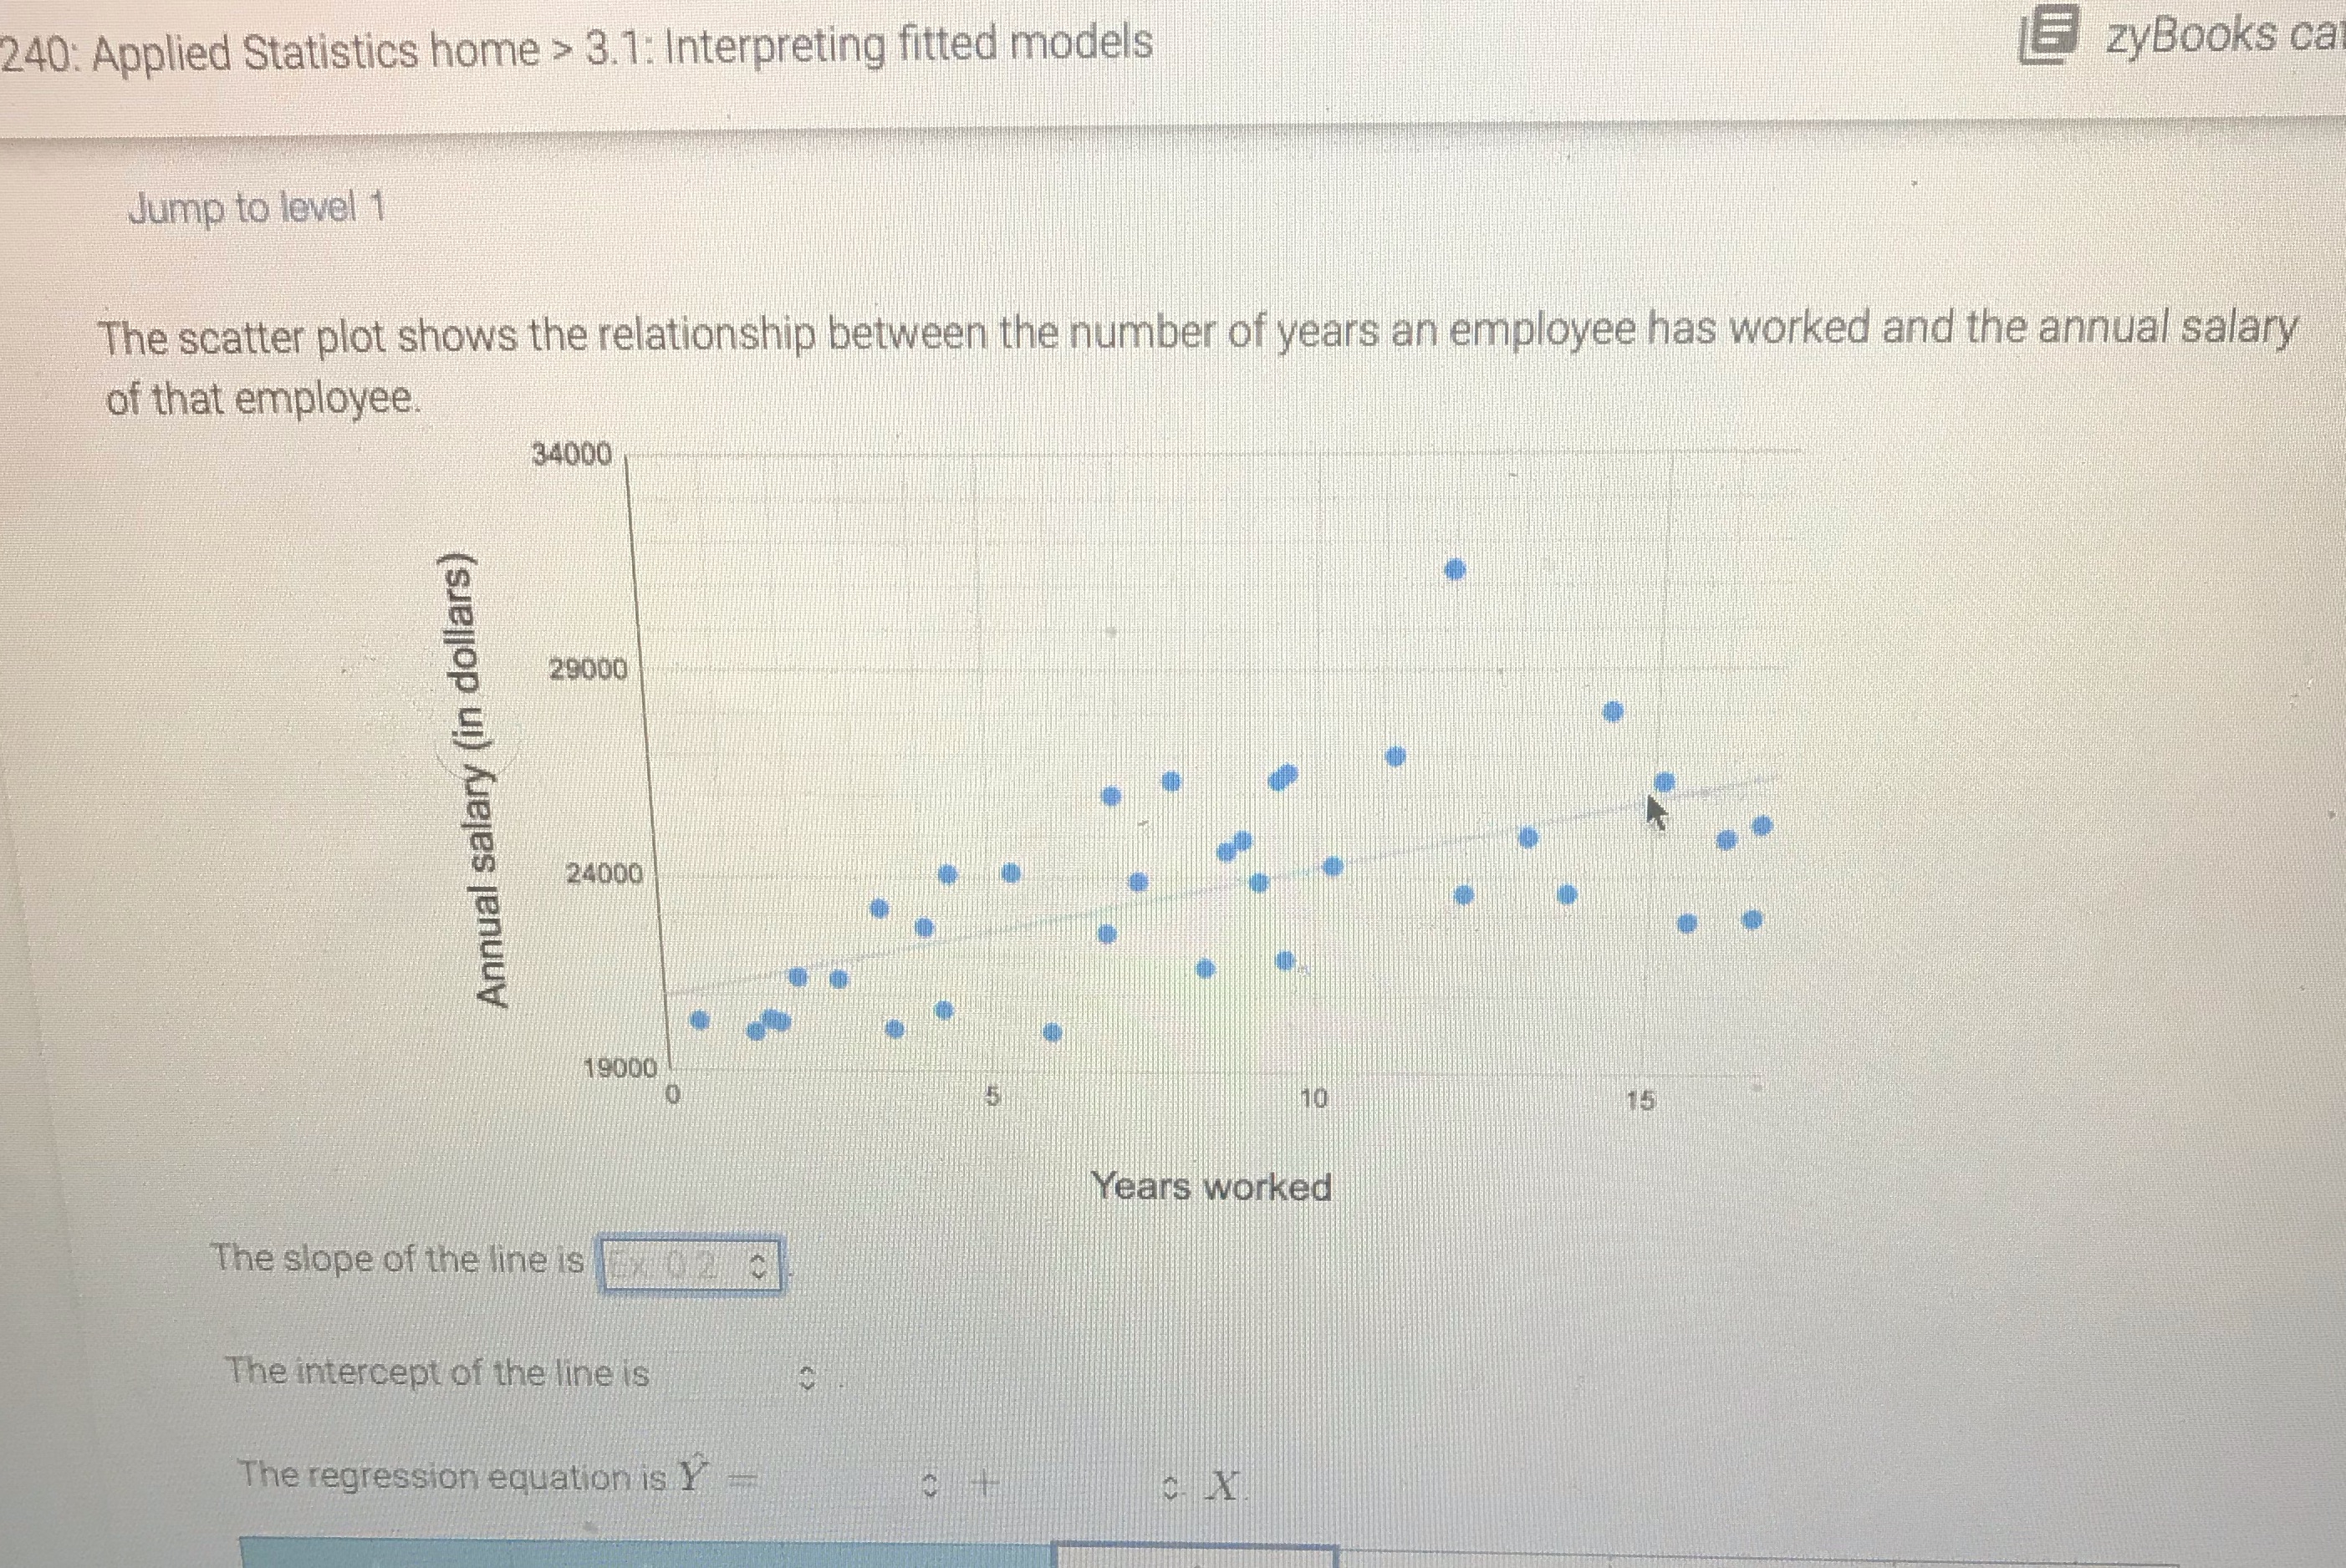
240: Applied Statistics home > 3.1: Interpreting fitted models EzyBooks ca Jump to level 1 The scatter plot shows the relationship between the number of years an employee has worked and the annual salary of that employee. 34000 29000 Annual salary (in dollars) 24000 19000 10 15 Years worked The slope of the line is The intercept of the line is The regression equation is Y C. X
Step by Step Solution
There are 3 Steps involved in it
1 Expert Approved Answer
Step: 1 Unlock

Question Has Been Solved by an Expert!
Get step-by-step solutions from verified subject matter experts
Step: 2 Unlock
Step: 3 Unlock