

Question: Please help me solve this chart. Please show work and formulas. Information for the chart is given below. If correct, I will make sure to
 Please help me solve this chart. Please show work and formulas. Information for the chart is given below.
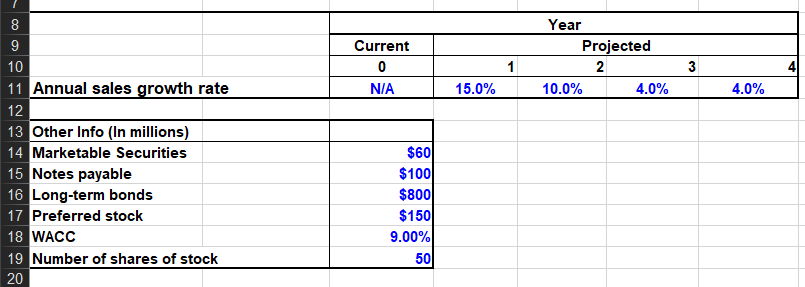 If correct, I will make sure to thumbs up. Thank you!
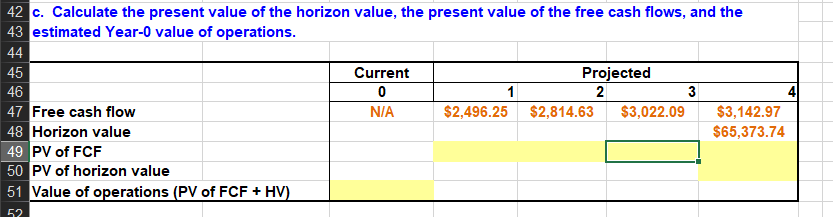
Calculate the present value of the horizon value, the present value of the free cash flows, and the 42 4 3 estimated Year-0 value of operations. 45 47 Current Projected 4 Free cash flow NIA $2,496.25 $2,814.63 $3,022.09 $3,142.97 $65,373.74 PV of FCF 0 PV of horizon value til Waluo@ntpoia(py (n'ter.::.tIV) 52 50 Year 9 Current Projected 4 Annual sales growth rate NIA 15.0% 10.0% 4.0% 4.0% Other Info (In millions Marketable Securities Notes payable Long-term bonds Preferred stock WACC Number of shares of stock $60 $100 $800 $150 9.00% 50 15 20
Step by Step Solution
There are 3 Steps involved in it

Get step-by-step solutions from verified subject matter experts