

Question: Please help me solve this excel assignment by giving me exact detailed step by step instructions with where to locate excel tools. Project Description: YO
Please help me solve this excel assignment by giving me exact detailed step by step instructions with where to locate excel tools. Project Description: YOExcelChPrepare Expansion
Analysis Part B
Excels WhatIf Analysis tools.
Steps to Perform:
Step Instructions Points Possible
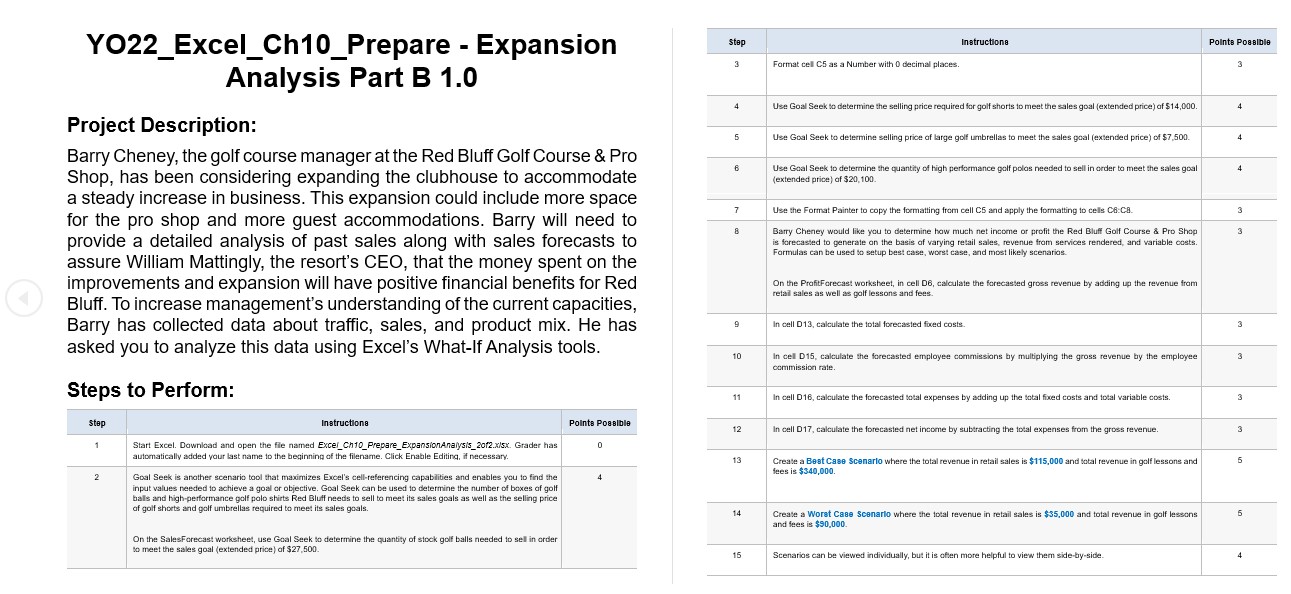
Start Excel. Download and open the file named ExcelChPrepareExpansionAnalysisofxlsx Grader has automatically added your last name to the beginning of the filename. Click Enable Editing, if necessary.
Goal Seek is another scenario tool that maximizes Excels cellreferencing capabilities and enables you to find the input values needed to achieve a goal or objective. Goal Seek can be used to determine the number of boxes of golf balls and highperformance golf polo shirts Red Bluff needs to sell to meet its sales goals as well as the selling price of golf shorts and golf umbrellas required to meet its sales goals.
On the SalesForecast worksheet, use Goal Seek to determine the quantity of stock golf balls needed to sell in order to meet the sales goal extended price of $
Format cell C as a Number with decimal places.
Use Goal Seek to determine the selling price required for golf shorts to meet the sales goal extended price of $
Use Goal Seek to determine selling price of large golf umbrellas to meet the sales goal extended price of $
Use Goal Seek to determine the quantity of high performance golf polos needed to sell in order to meet the sales goal extended price of $
Use the Format Painter to copy the formatting from cell C and apply the formatting to cells C:C
Barry Cheney would like you to determine how much net income or profit the Red Bluff Golf Course & Pro Shop is forecasted to generate on the basis of varying retail sales, revenue from services rendered, and variable costs. Formulas can be used to setup best case, worst case, and most likely scenarios.
On the ProfitForecast worksheet, in cell D calculate the forecasted gross revenue by adding up the revenue from retail sales as well as golf lessons and fees.
In cell D calculate the total forecasted fixed costs.
In cell D calculate the forecasted employee commissions by multiplying the gross revenue by the employee commission rate.
In cell D calculate the forecasted total expenses by adding up the total fixed costs and total variable costs.
In cell D calculate the forecasted net income by subtracting the total expenses from the gross revenue.
Create a Best Case Scenario where the total revenue in retail sales is $ and total revenue in golf lessons and fees is $
Create a Worst Case Scenario where the total revenue in retail sales is $ and total revenue in golf lessons and fees is $
Scenarios can be viewed individually, but it is often more helpful to view them sidebyside.
Generate a Scenario Summary report to show the results of the current scenario, Best Case Scenario, and Worst Case Scenario. Make sure that the result cell is set to D Net Income.
Format the Scenario Summary report so that it is easier to read by completing the following.
Merge & Center cells B:C and replace the text $D$ with Retail Sales. Merge & Center cells B:C and replace the text $D$ with Lessons and Fees. Merge & Center cells B:C and replace the text $D$ with Net Income.
Edit the Best Case Scenario so that the changing cells are D:D and C Keep the current scenario value for cell C as
Edit the Worst Case Scenario so that the changing cells are D:D and C Change the scenario value for C to
Create a new Most Likely Scenario using D:D and C as the changing cells. Set the scenario value for D to D to and C to
Create a Scenario PivotTable report to show the gross revenue, commission, and net income of each scenario. Use cells D C and D as the result cells.
Format the Scenario PivotTable report so that it is easier to read by completing the following. In cell A replace existing text with Retail Sales and Golf Lessons and Fees. Adjust the width of Column A to In cell A type Scenario PivotTable Report. Merge & Center cells A:D apply a Bold st
Step by Step Solution
There are 3 Steps involved in it
1 Expert Approved Answer
Step: 1 Unlock

Question Has Been Solved by an Expert!
Get step-by-step solutions from verified subject matter experts
Step: 2 Unlock
Step: 3 Unlock