

Question: please help me Tasks and Deliverables 1. Complete requested data for each scheduling algorithm. 2. Submitted this completed document to Webcourses. 1. Consider the arrival
please help me
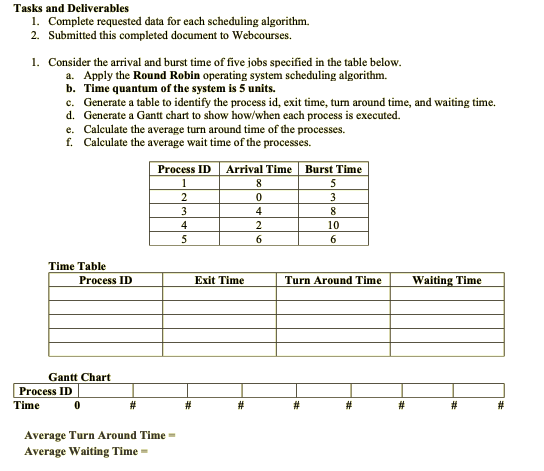
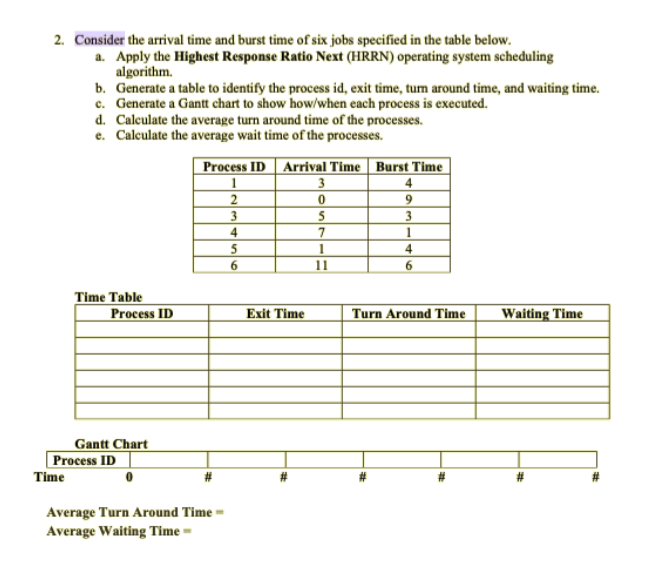
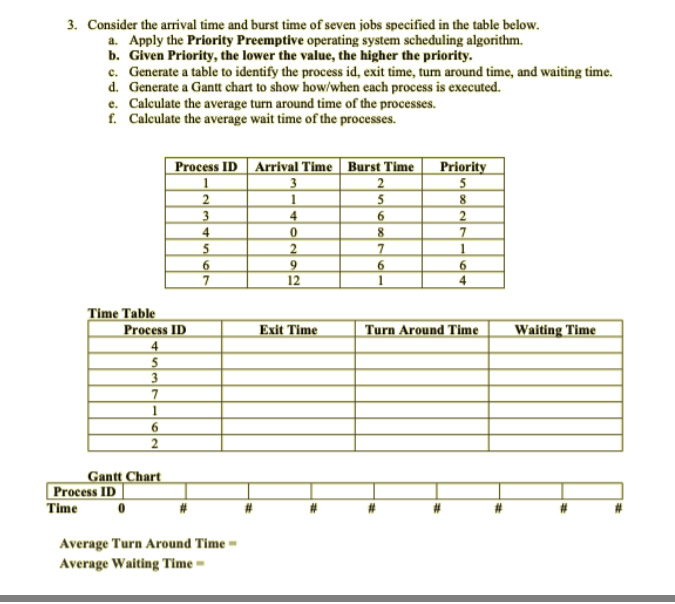
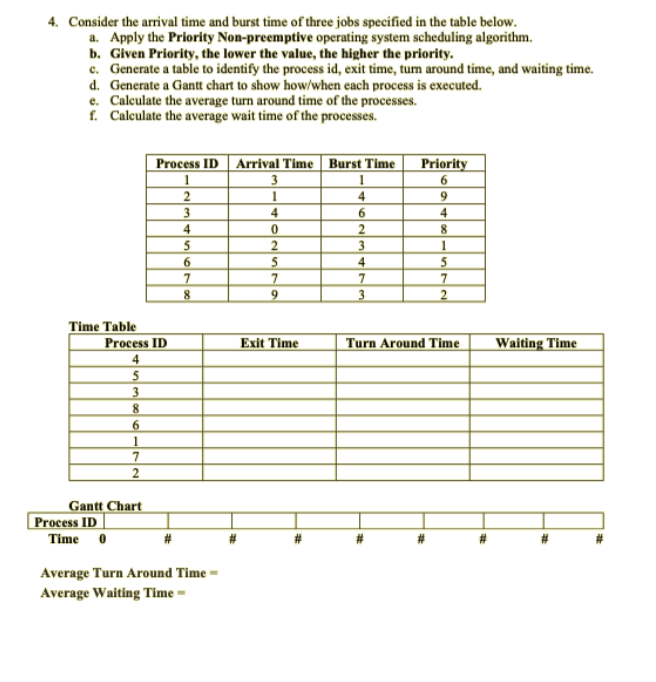
Tasks and Deliverables 1. Complete requested data for each scheduling algorithm. 2. Submitted this completed document to Webcourses. 1. Consider the arrival and burst time of five jobs specified in the table below. a. Apply the Round Robin operating system scheduling algorithm. b. Time quantum of the system is 5 units. c. Generate a table to identify the process id, exit time, turn around time, and waiting time. d. Generate a Gantt chart to show how/when each process is executed. e. Calculate the average turn around time of the processes. f. Calculate the average wait time of the processes. Process ID Arrival Time Burst Time 1 8 5 2 0 3 4 2 10 5 3 8 4 6 6 Time Table Process ID Exit Time Turn Around Time Waiting Time Gantt Chart Process ID Time # # # # # # # Average Turn Around Time - Average Waiting Time 2. Consider the arrival time and burst time of six jobs specified in the table below. a. Apply the Highest Response Ratio Next (HRRN) operating system scheduling algorithm. b. Generate a table to identify the process id, exit time, turn around time, and waiting time. c. Generate a Gantt chart to show how/when each process is executed. d. Calculate the average turn around time of the processes. e. Calculate the average wait time of the processes. Process ID 1 2 3 4 5 6 Arrival Time Burst Time 3 4 0 9 5 3 7 1 1 4 6 Time Table Process ID Exit Time Turn Around Time Waiting Time Gantt Chart Process ID Time Average Turn Around Time - Average Waiting Time - 3. Consider the arrival time and burst time of seven jobs specified in the table below. a. Apply the Priority Preemptive operating system scheduling algorithm. b. Given Priority, the lower the value, the higher the priority. c. Generate a table to identify the process id, exit time, turn around time, and waiting time. d. Generate a Gantt chart to show how/when each process is executed. e. Calculate the average turn around time of the processes. f. Calculate the average wait time of the processes. Process ID Arrival Time Burst Time 1 3 2 2 1 5 3 4 6 4 0 8 5 2 7 6 9 6 7 12 1 Priority 5 8 2 7 1 6 4 Exit Time Turn Around Time Waiting Time Time Table Process ID 4 5 3 7 1 6 2 Gantt Chart Process ID Time Average Turn Around Time Average Waiting Time 4. Consider the arrival time and burst time of three jobs specified in the table below. a. Apply the Priority Non-preemptive operating system scheduling algorithm. b. Given Priority, the lower the value, the higher the priority. c. Generate a table to identify the process id, exit time, tum around time, and waiting time. d. Generate a Gantt chart to show how/when each process is executed. e. Calculate the average turn around time of the processes. f. Calculate the average wait time of the processes. Process ID 2 3 4 S 6 7 8 Arrival Time Burst Time 3 1 4 4 6 0 2 2 3 5 4 7 7 9 3 Priority 6 9 4 8 1 5 2 Exit Time Turn Around Time Waiting Time Time Table Process ID 4 5 3 8 6 1 7 2 Gantt Chart Process ID Time 0 # # Average Turn Around Time - Average Waiting Time
Step by Step Solution
There are 3 Steps involved in it

Get step-by-step solutions from verified subject matter experts