

Question: Tasks and Deliverables 1. Complete requested data for each scheduling algorithm. 2. Submitted this completed document to Webcourses. 1. Consider the arrival and burst time
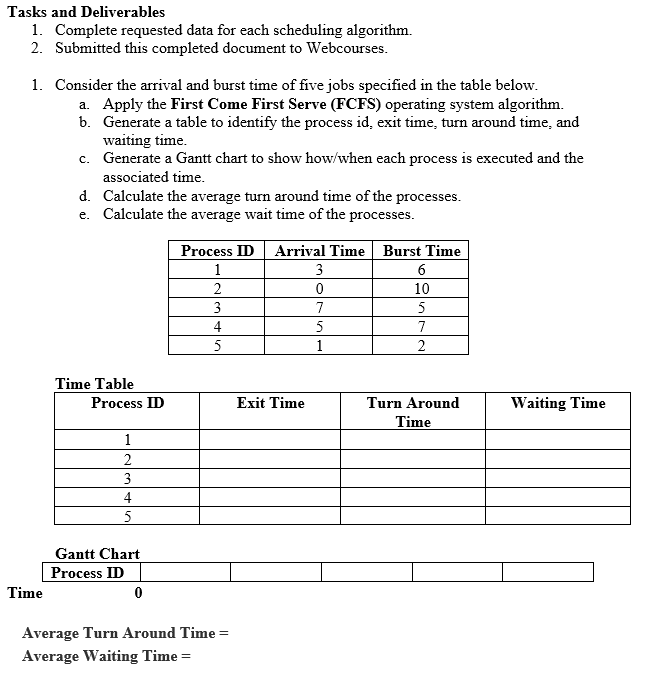
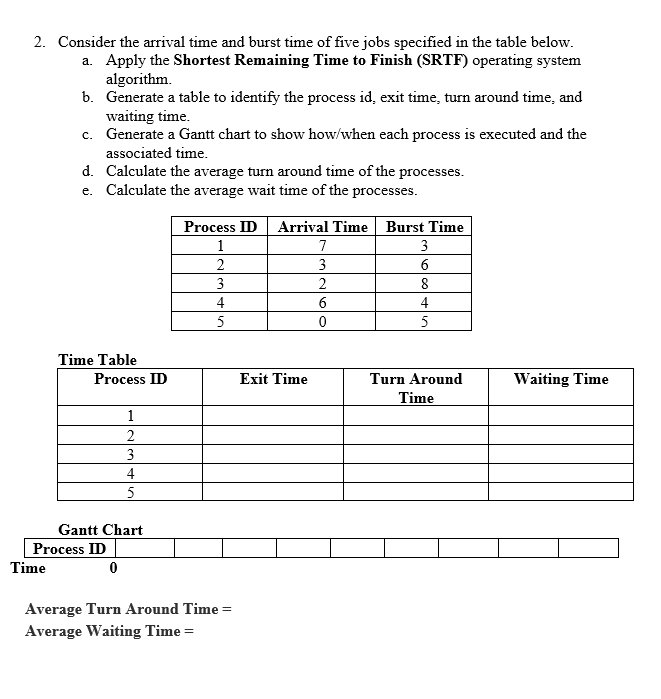
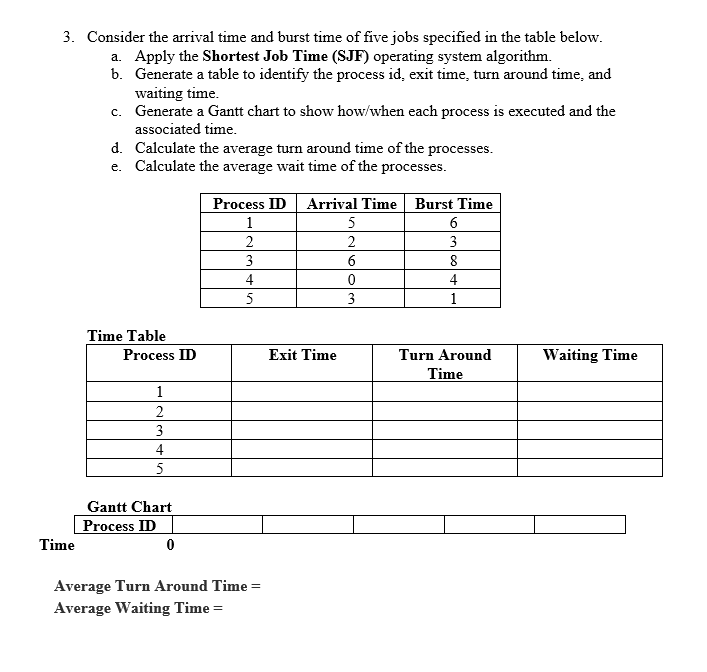
Tasks and Deliverables 1. Complete requested data for each scheduling algorithm. 2. Submitted this completed document to Webcourses. 1. Consider the arrival and burst time of five jobs specified in the table below. a. Apply the First Come First Serve (FCFS) operating system algorithm. b. Generate a table to identify the process id. exit time, turn around time, and waiting time. c. Generate a Gantt chart to show how/when each process is executed and the associated time. d. Calculate the average turn around time of the processes. e. Calculate the average wait time of the processes. Process ID 1 2 3 4 5 Arrival Time 3 0 7 5 1 Burst Time 6 10 5 7 2 Time Table Process ID Exit Time Waiting Time Turn Around Time 1 2 3 4 5 Gantt Chart Process ID 0 Time Average Turn Around Time = Average Waiting Time = 2. Consider the arrival time and burst time of five jobs specified in the table below. a. Apply the shortest Remaining Time to Finish (SRTF) operating system algorithm b. Generate a table to identify the process id, exit time, turn around time, and waiting time. c. Generate a Gantt chart to show how/when each process is executed and the associated time. d. Calculate the average turn around time of the processes. e. Calculate the average wait time of the processes. Process ID Arrival Time Burst Time 1 7 3 2 3 6 3 2 8 6 4 5 0 5 Time Table Process ID Exit Time Turn Around Time Waiting Time 1 2 3 4 5 Gantt Chart Process ID Time 0 Average Turn Around Time = Average Waiting Time = 3. Consider the arrival time and burst time of five jobs specified in the table below. a. Apply the Shortest Job Time (SJF) operating system algorithm. b. Generate a table to identify the process id. exit time, turn around time, and waiting time. C. Generate a Gantt chart to show how/when each process is executed and the associated time. d. Calculate the average turn around time of the processes. e. Calculate the average wait time of the processes. Process ID 1 2 3 4 5 Arrival Time Burst Time 5 6 2 3 6 8 0 4 3 1 Time Table Process ID Exit Time Waiting Time Turn Around Time 1 2 3 4 5 Gantt Chart Process ID Time 0 Average Turn Around Time = Average Waiting Time =
Step by Step Solution
There are 3 Steps involved in it

Get step-by-step solutions from verified subject matter experts